


In March 2022, Manchester City Women’s defender Alex Greenwood started negotiating a new contract.
She was 28, had just over a year left on her deal, and wanted two things: to stay at City and get a significant salary increase.
A little bit of context if you, like me, just started following women’s football.
Greenwood was one of the best defenders in the Women’s Super League (WSL), which is the highest tier in English football. She was also an England international. Pretty much by every account, an elite player. And yet, she was still facing a version of:
“We don’t pay women that much.”
Fast forward to December 2022 when she signed her new three-year contract with on significantly more lucrative terms.
How did she do it?
She brought data scientists to the negotiation table.
The same team that helped Kevin De Bruyne negotiate his €80M contract extension. The consultants had a pretty unusual problem to solve though. City already knew Greenwood was good. The difficult part was putting a price on how good she was.
Think about it. In the men’s game, you have transfer fees. Public salary estimates. Hundreds of comparable deals. If you want to argue that your client deserves a £60k-a-week raise on her current £120k, there are plenty of players you can point to.
Women’s football in 2022 was different. Hardly any transfer fees. No public salary database. Very few obvious benchmarks.
So how exactly are you supposed to benchmark that?
Well, Harvard Business School (HBS) did a case study on the topic and today I’ll deconstruct what (likely) happened behind closed doors.
So here are the 7 inventive methods her data scientists used to get her the raise she wanted.
1. Nobody moved the ball like Greenwood
I know I just promised you inventive methods, but before we get to them, let’s establish her playing time. Since joining City during the 2020/21 season and until the cut off date of 1 December 2022, Greenwood was an established starter that played 46 of the available 50 league matches and 88% of the available minutes.
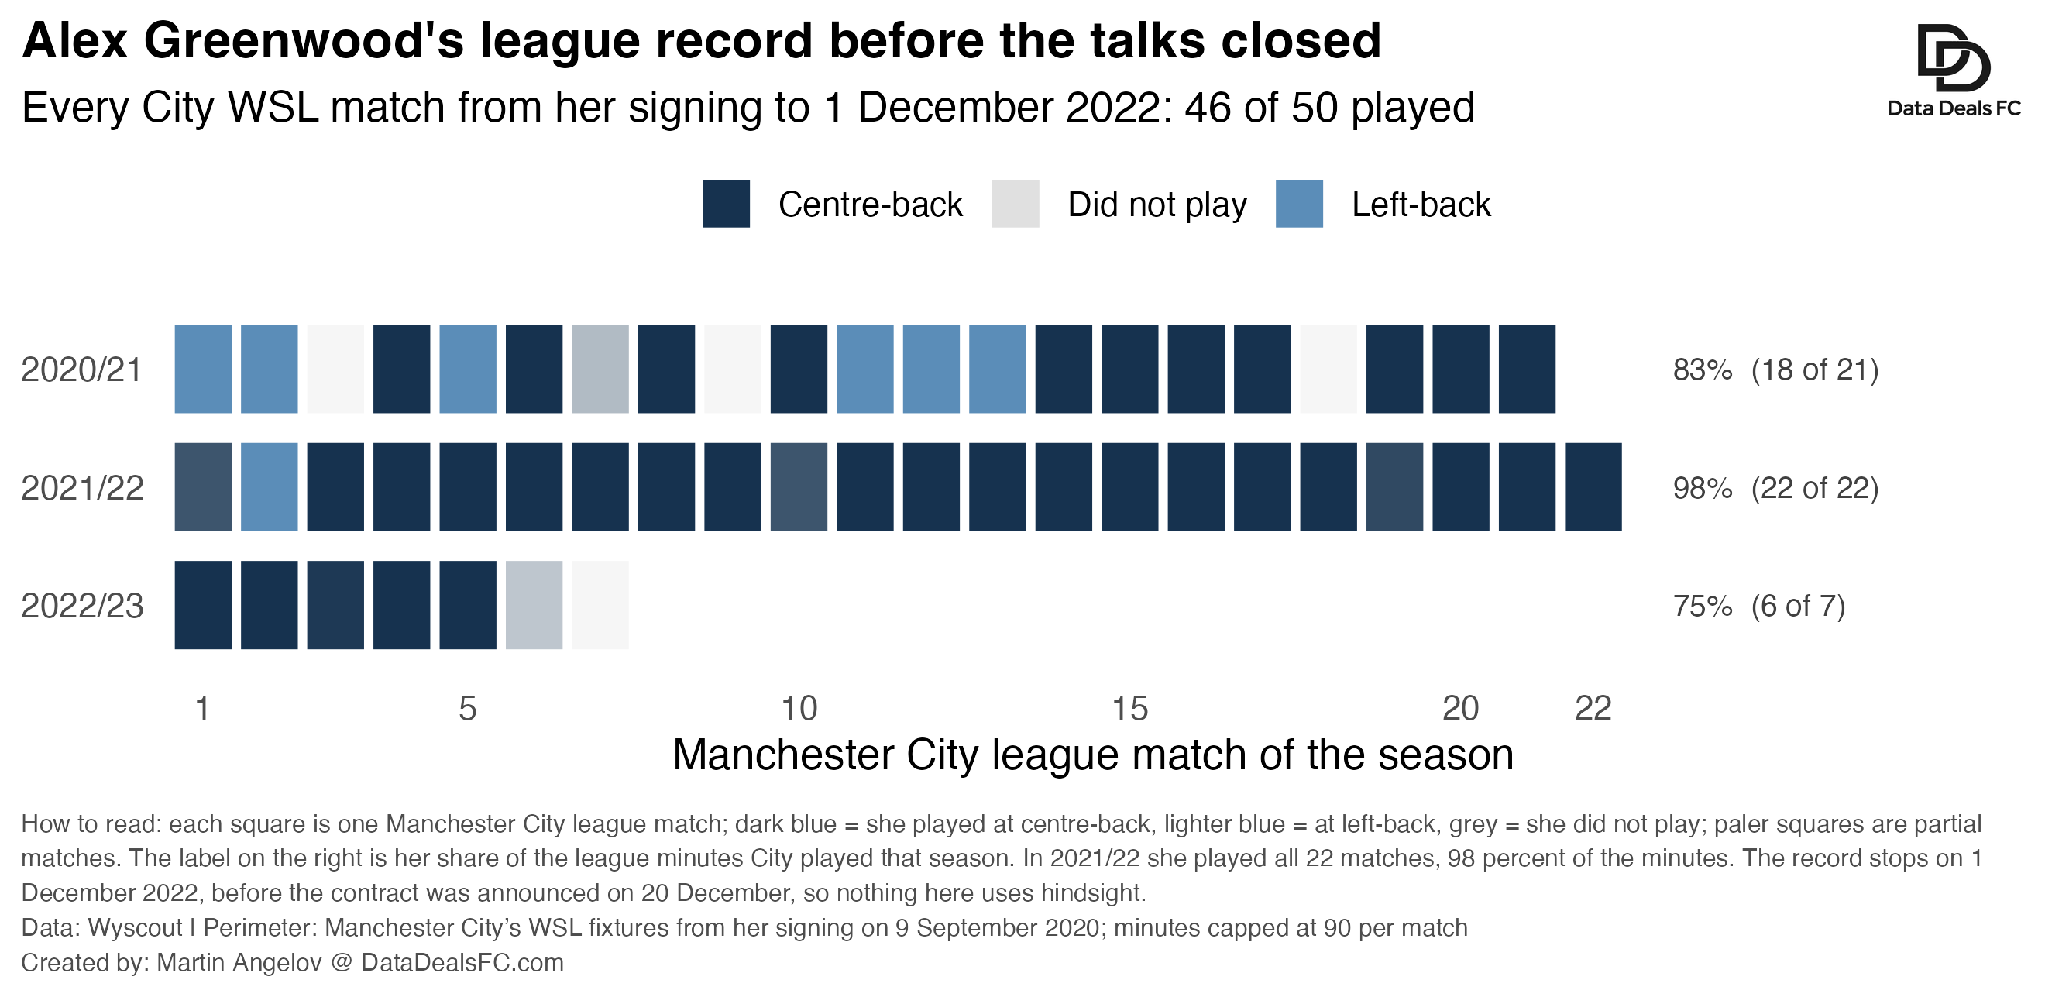
I’m not going to make a big case out of his reliability (in the way Ben White did), but just consider that in the women’s game in England during that same period, the median outfield player played 47% of all available minutes.
Ok, now to the fun part. The first advanced metric used in her favor, according to the HBS case study, was illustrating what she did with ball. Analytics FC used their proprietary goal difference added metric. Now, obviously I do not have that, so a built a simpler expected threat model from the publicly available Statsbomb dataset. I won’t bore you with the maths. Basically, it asks a simple question: how much closer to scoring did her actions move City?
Well it turns out nobody moved the ball into danger like Alex Greenwood.
On that measure alone, during the 2020/21 season she added 0.42 xG per 90 minutes from ball progression.
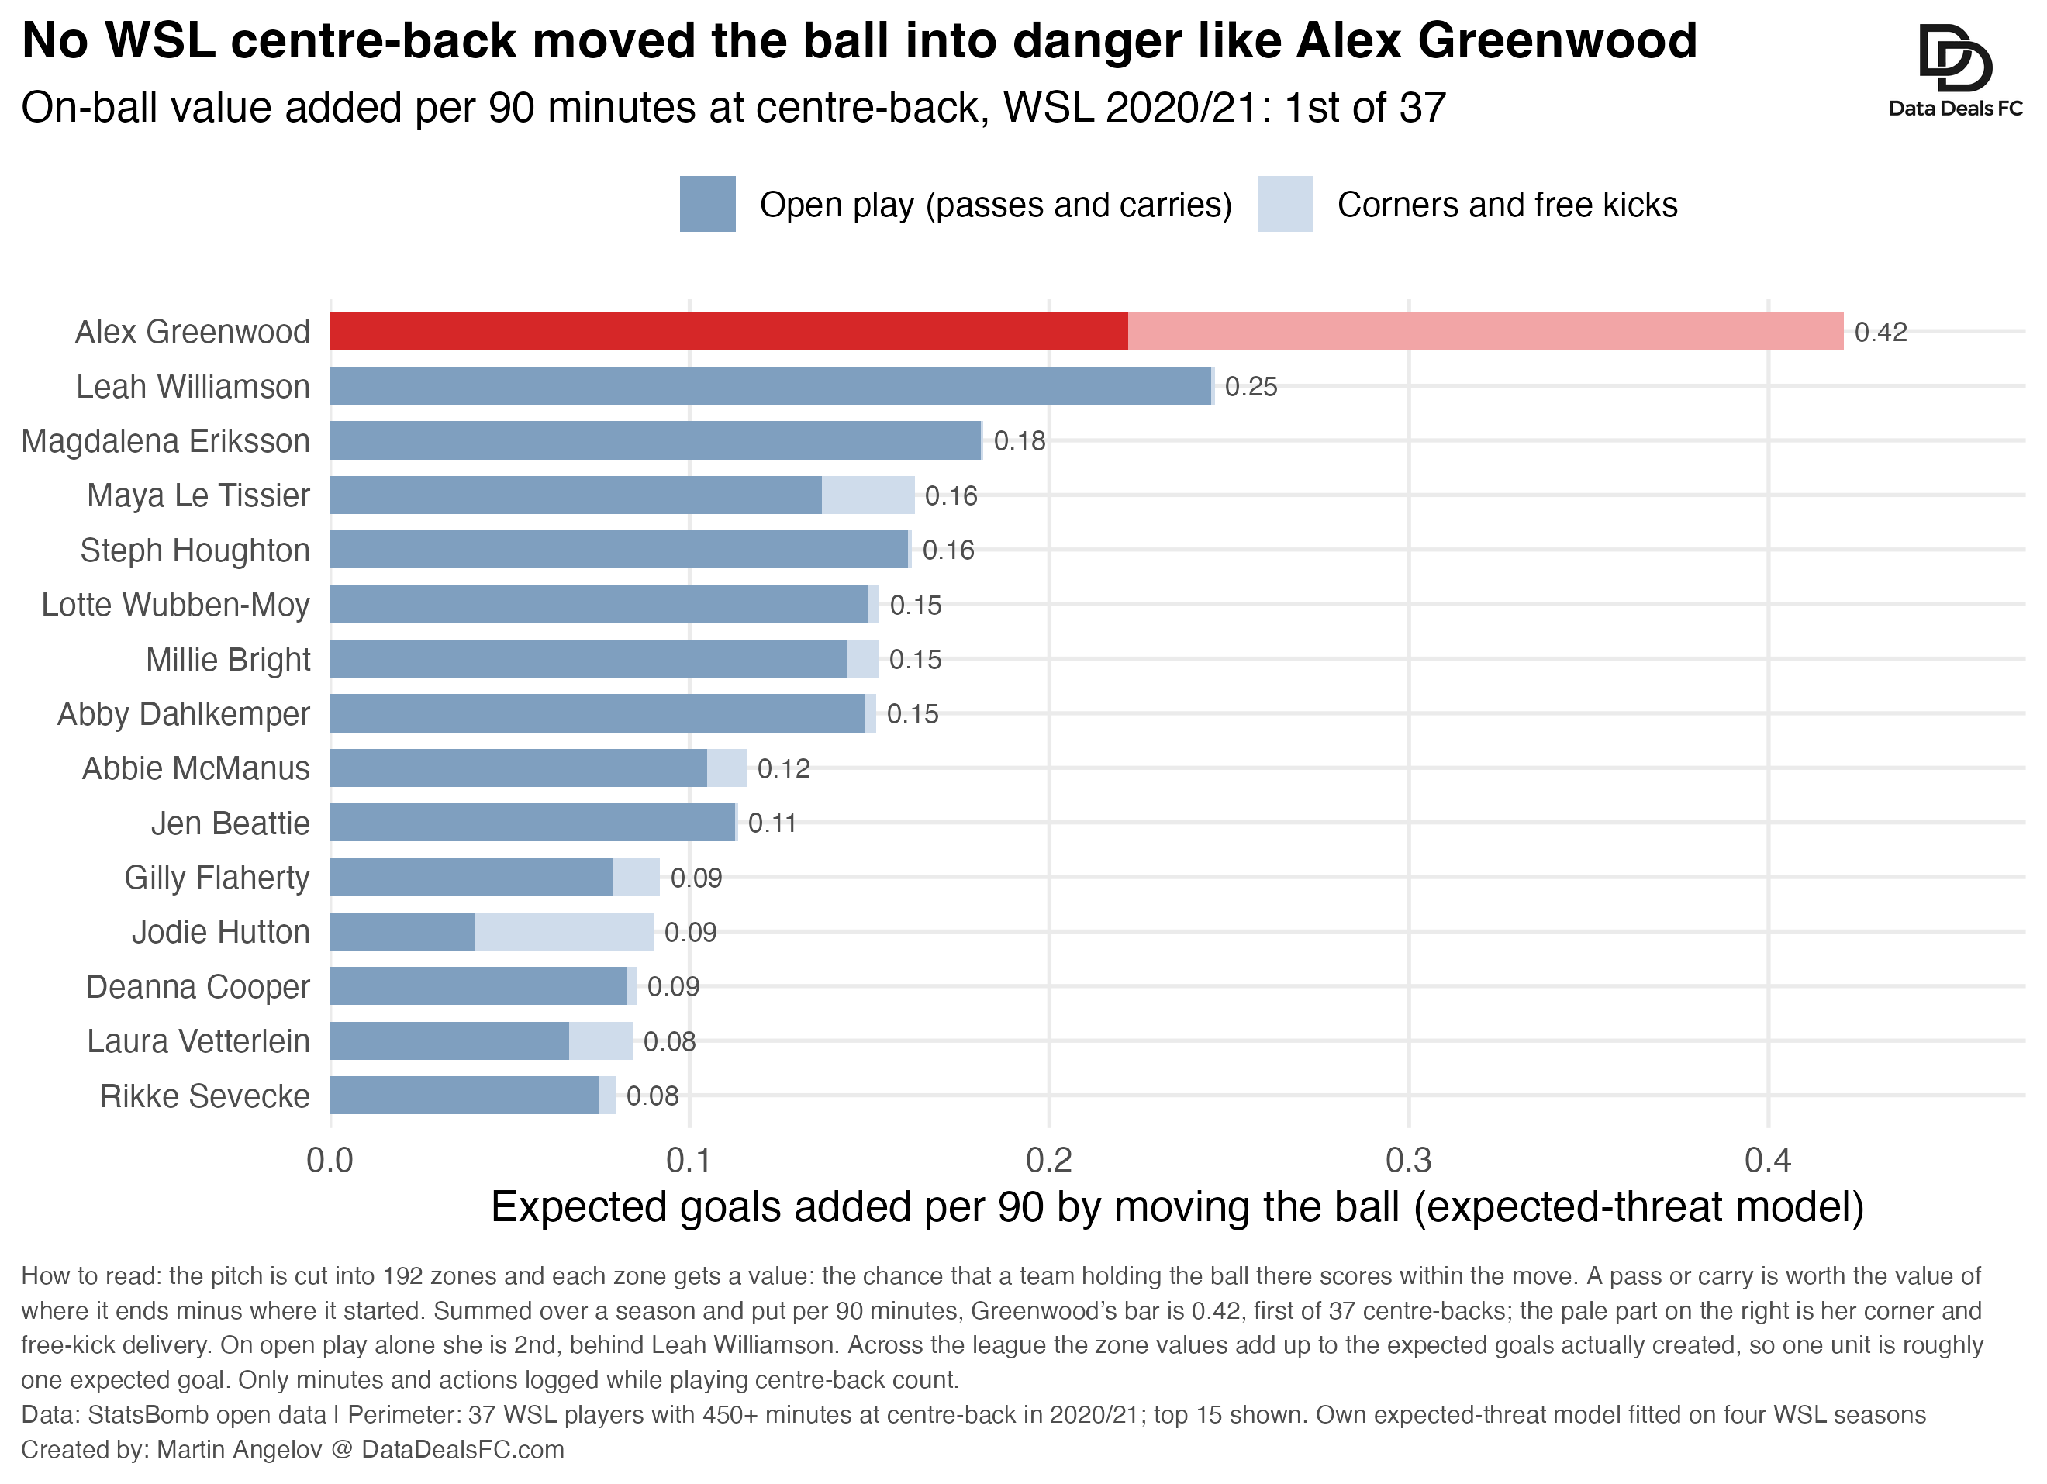
What’s more, she ranked 4th of all 213 WSL outfield players on ball-progression value per 90 (attackers included).
And if you are like me and enjoy poking into other people’s arguments, yes she did take corners and freekicks, (which explains half of the xG), but even on open play alone she sits at the 82nd percentile of forwards, which is still better than four in five forwards.
Okay, that’s a great start, isn’t it?
2. The harder the pass, the better Greenwood looked
The second killer argument was the passes she completed. Her data science team successfully illustrated that she completed harder passes than she was supposed to. Here’s what I mean her data team meant.
Instead of looking at plain pass completion rate, they looked into her expected passes. Yes, that’s the same ideas as xG but for passes. Instead of asking how many passes Greenwood completed, the model asks how difficult those passes actually were. I trained a model on 296,000 WSL passes. Based on where a pass starts, where it goes and the situation around it, the model estimates how likely an average player was to complete it.
Well, Alex Greenwood completed 83.7% of those when she should have done 79.1%, or 4.6 percentage points above expectation.
That’s an over-performance that puts her 2nd among the 179 WSL players.
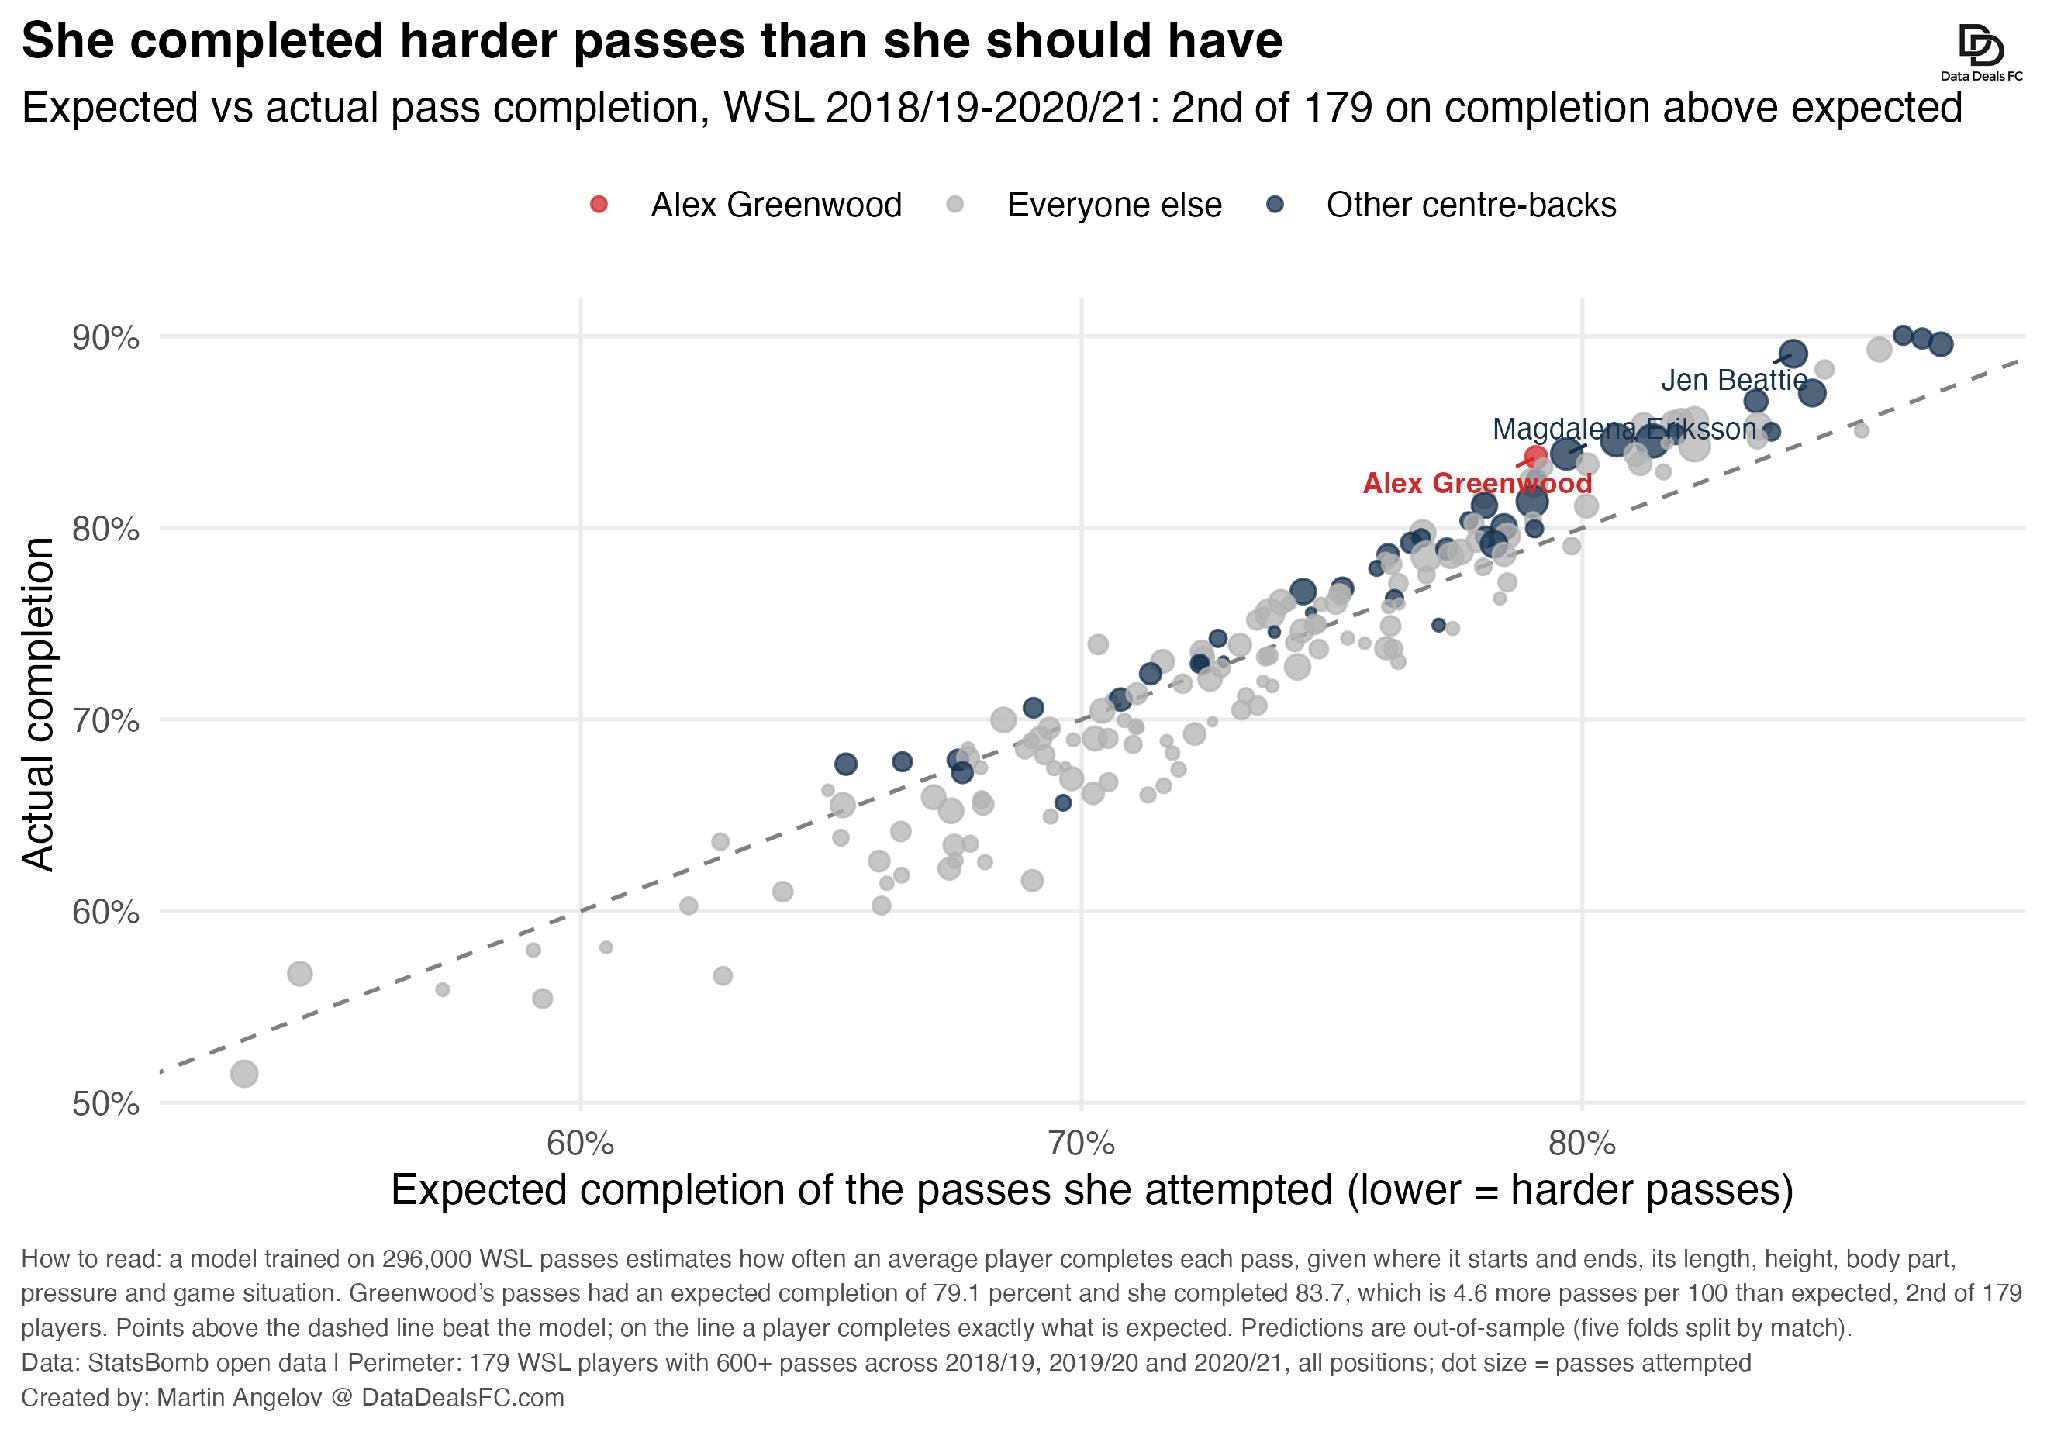
If I use all available data (USA’s national women’s soccer league, 2019 World Cup and Euro 2022), she “falls” to 6th. Combine this with the fact that Greenwood attempted more passes and created more danger than any defender in the WSL (see first section), and you had a very clear picture. So she wasn’t just completing lots of easy passes. She attempted a lot, tried difficult ones, and still completed more than expected.
And then comes City’s counter-argument.
3. Yes, but a defender is supposed to defend
There was one obvious argument that was supposed to eventually surface. “While exceptional at creating threat, Greenwood was still a defender. So she is supposed to defend, isn’t she?” - would the Citizens’ negotiators say.
And her defending numbers did not look that strong. At least not elite level strong. Tackles and interceptions put her around the 29th percentile of WSL centre backs. If I was sitting on City's side of the table, I know I would certainly bring that up.
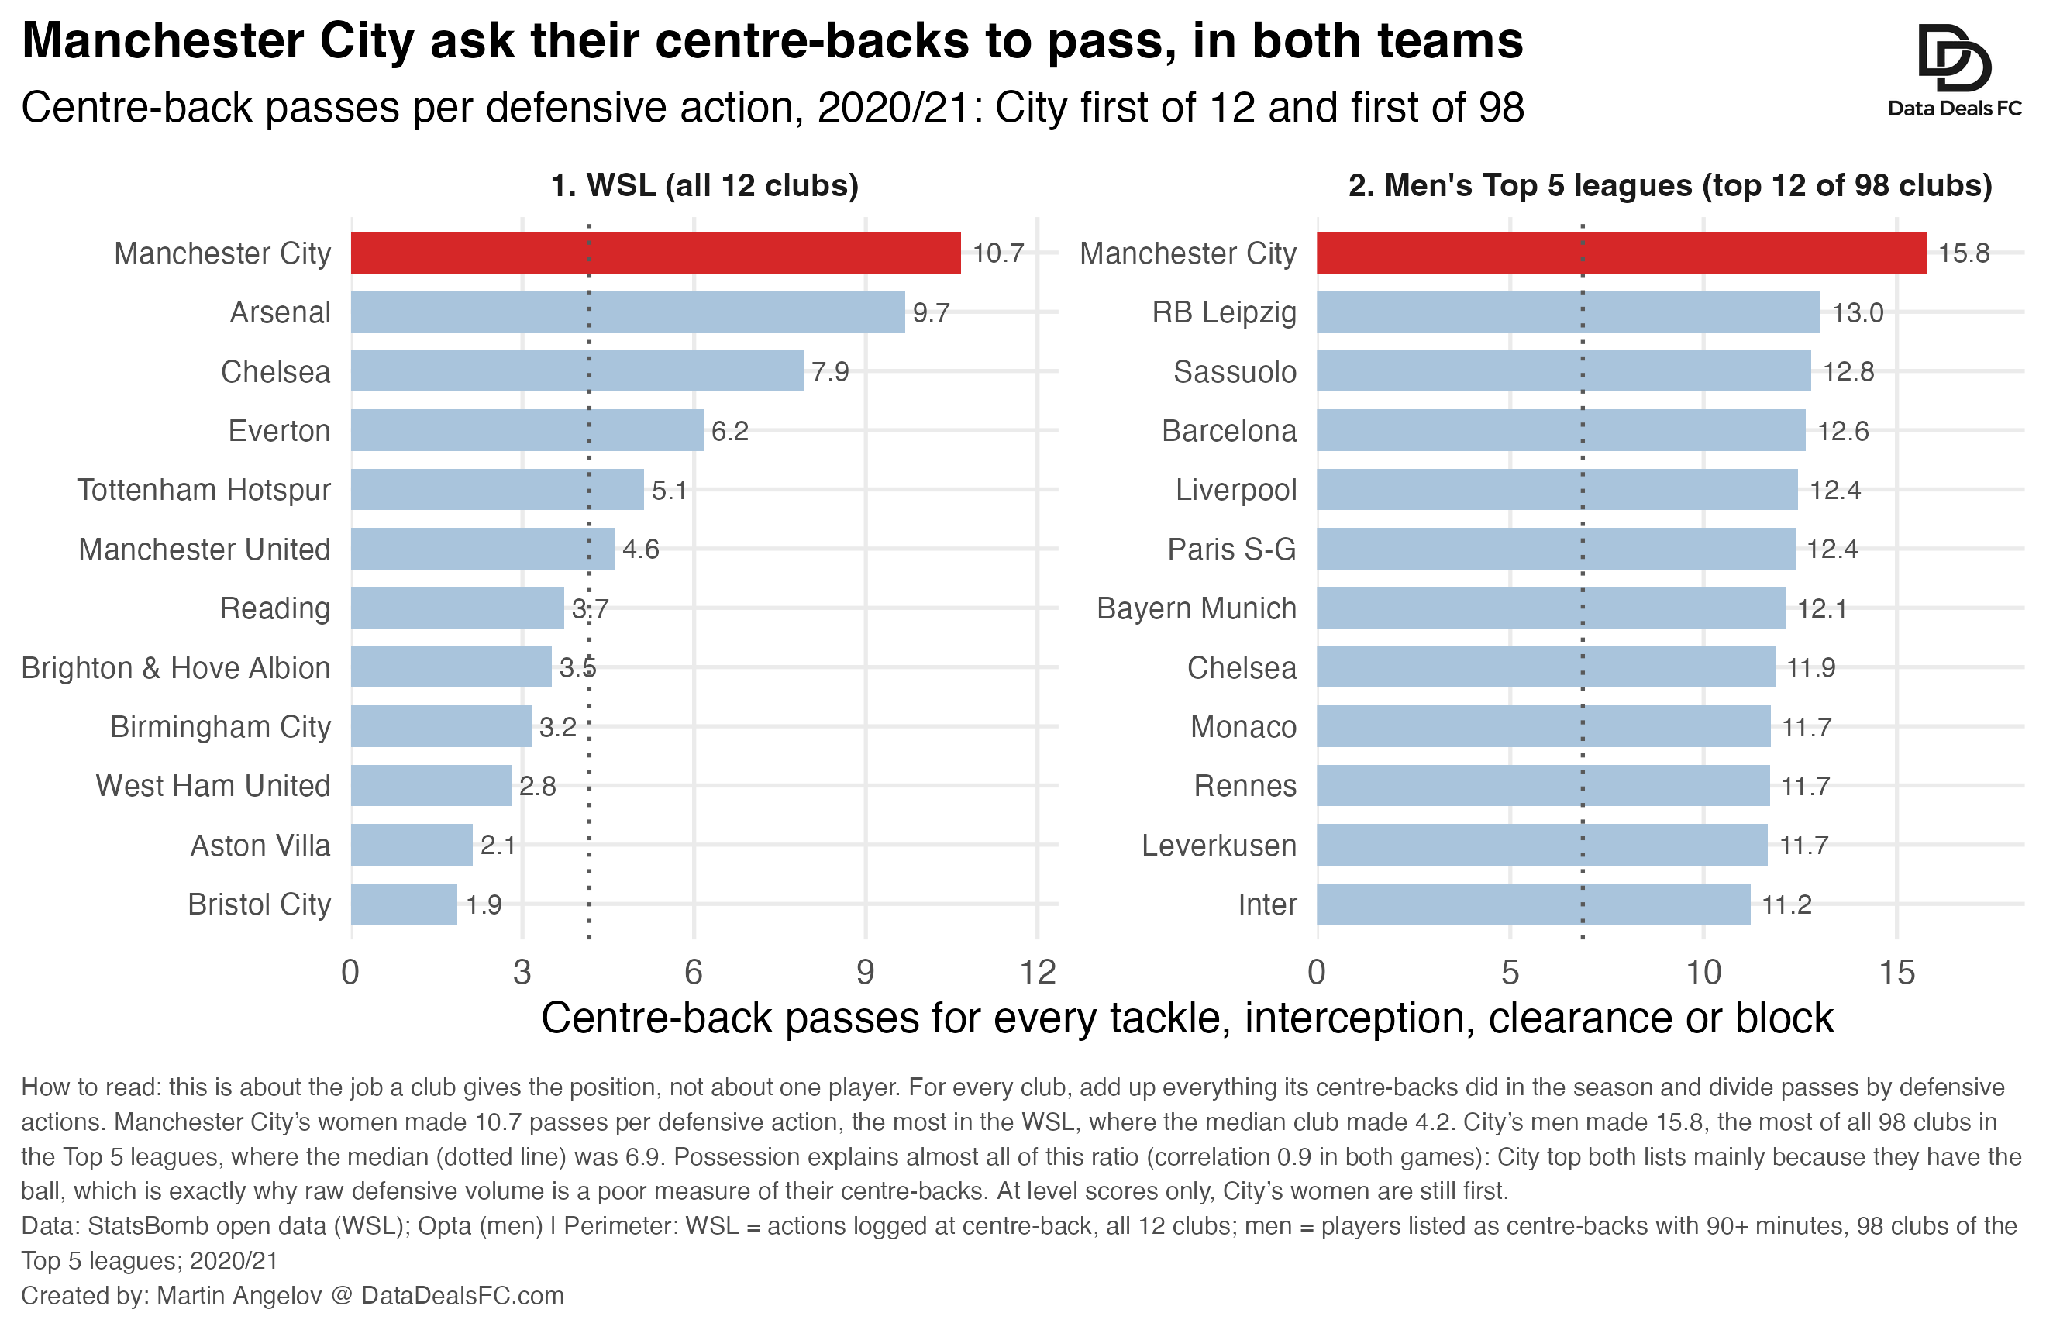
Instead of pretending those numbers were wrong, Analytics FC, turned the question around. Okay, but what does Man City actually ask its centre backs to do? Because you see, if your team has a lot of the ball, then maybe most of the time you would be expected to play with it.
The figure below presents the teams’ passes per defensive action of all defenders. City’s women made 10.7 passes for every tackle, interception, clearance or block. First in the WSL. City’s men made 15.8. First of 98 clubs across Europe’s big five leagues.
City have the ball more, so of course their defenders defend less.
Also, when compared to men’s team superstar defenders, Greenwood sit comfortably well among Aymeric Laporte, Ruben Dias and John Stones. On tackles plus interceptions, Greenwood stood at 29th percentile vs Stones and Dias’ 7th percentile and Laporte’s 2nd. Ouch. Are they bad defenders as well? I guess Pep didn’t know any better.
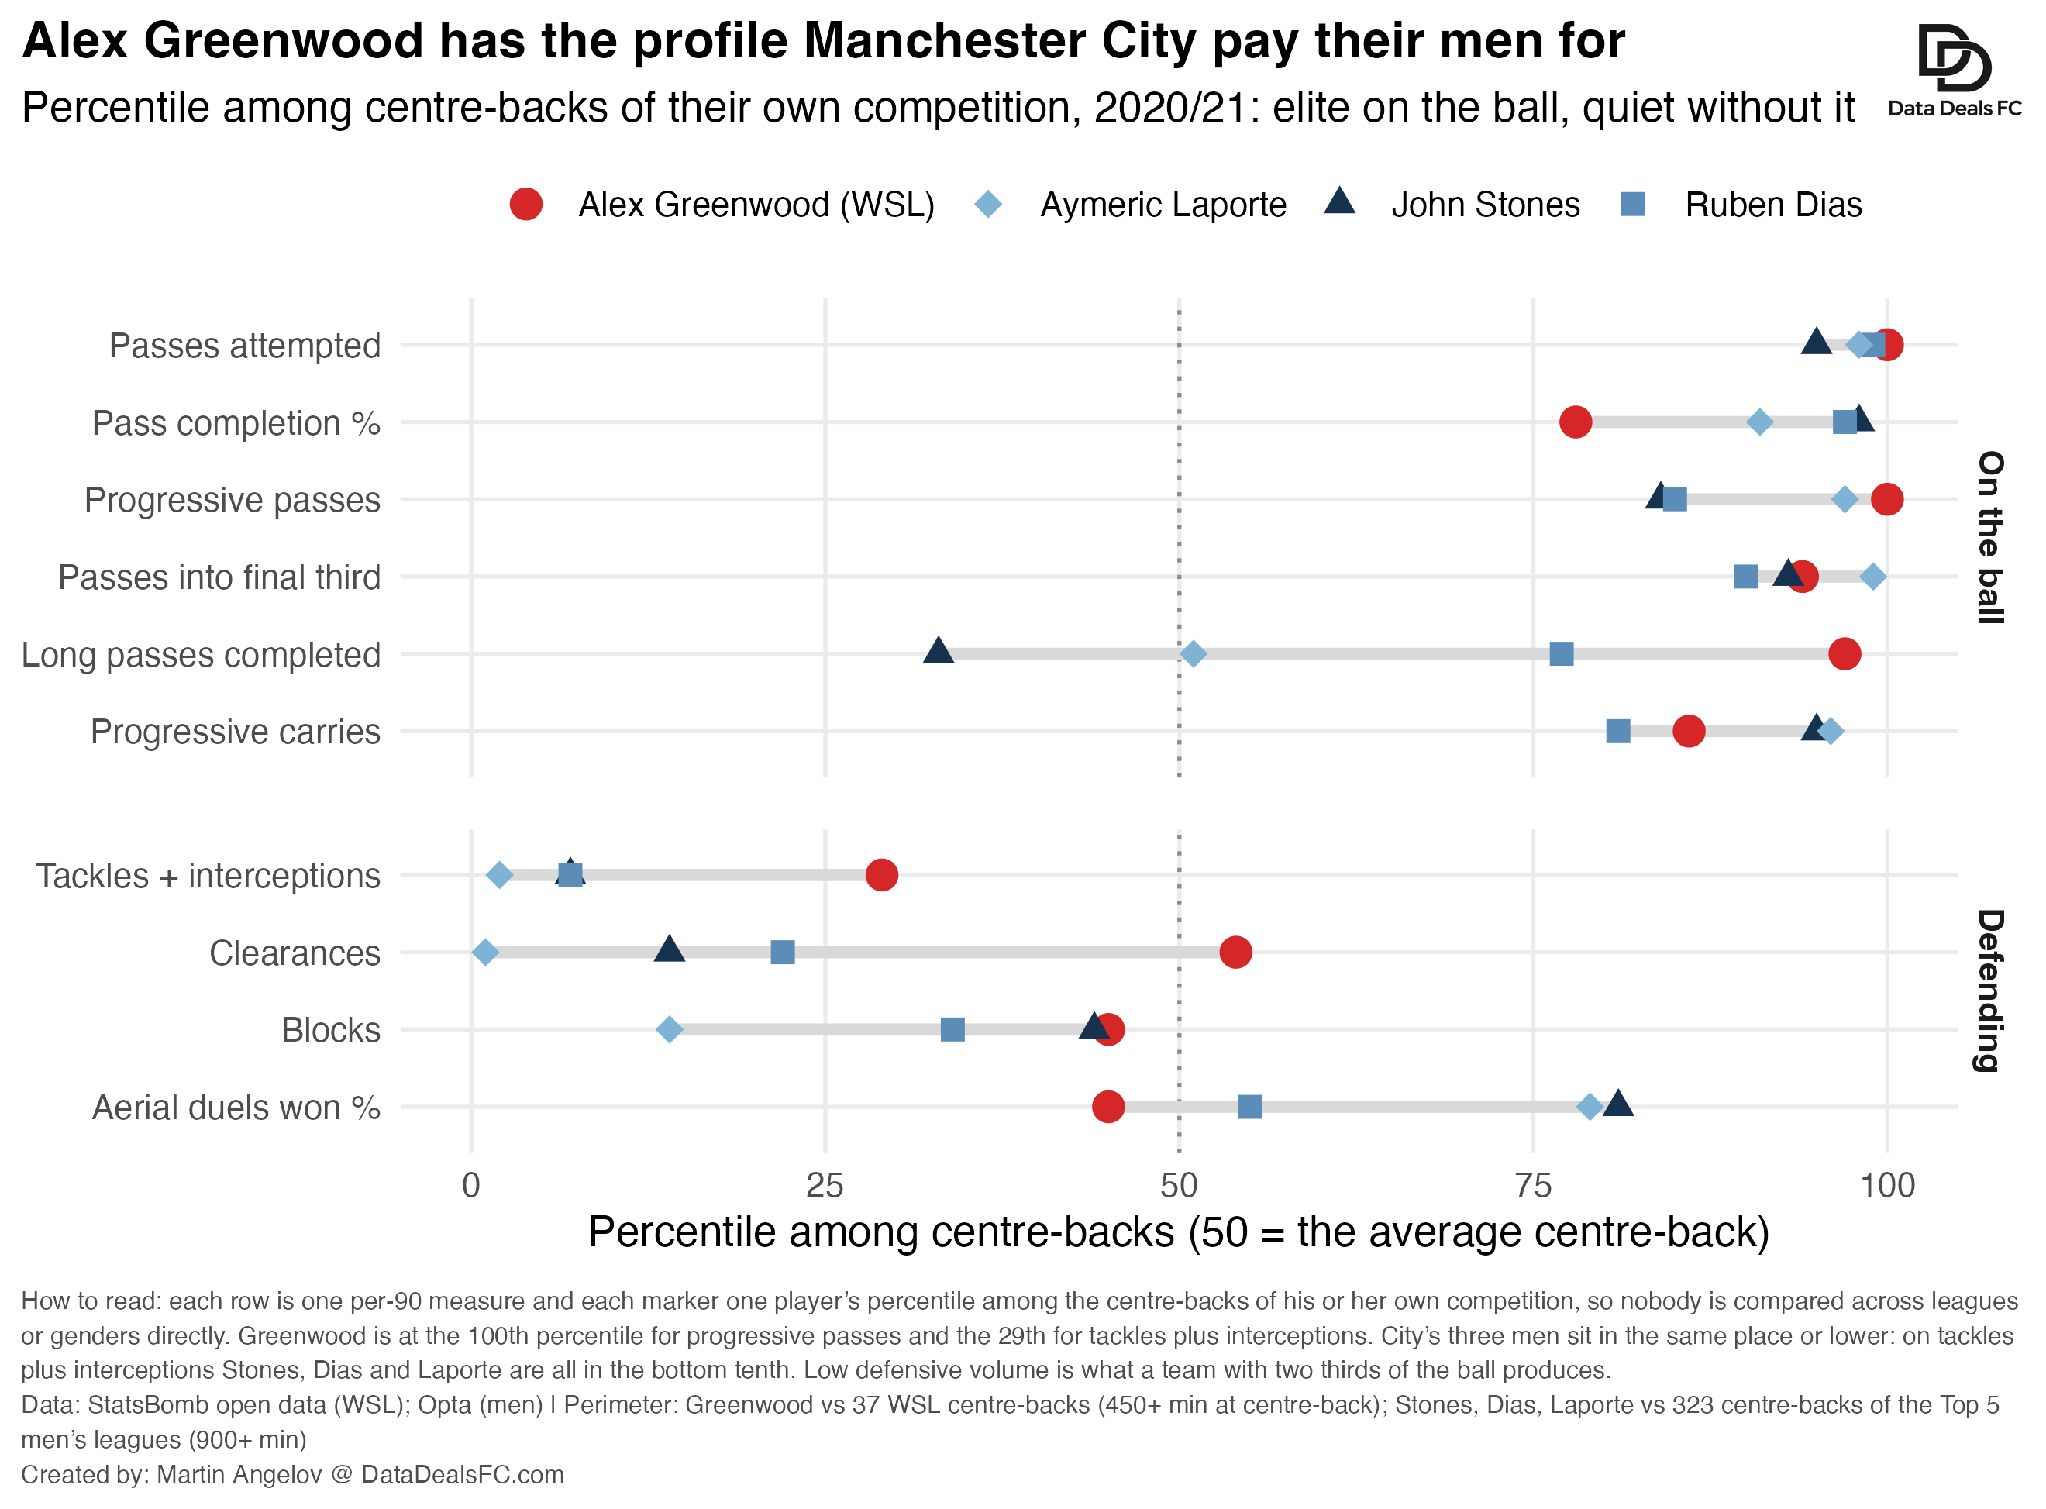
So no, she was not a bad defender. That’s what a City center back looks like. In fact, the more of the ball a team has, the less its center backs defend.
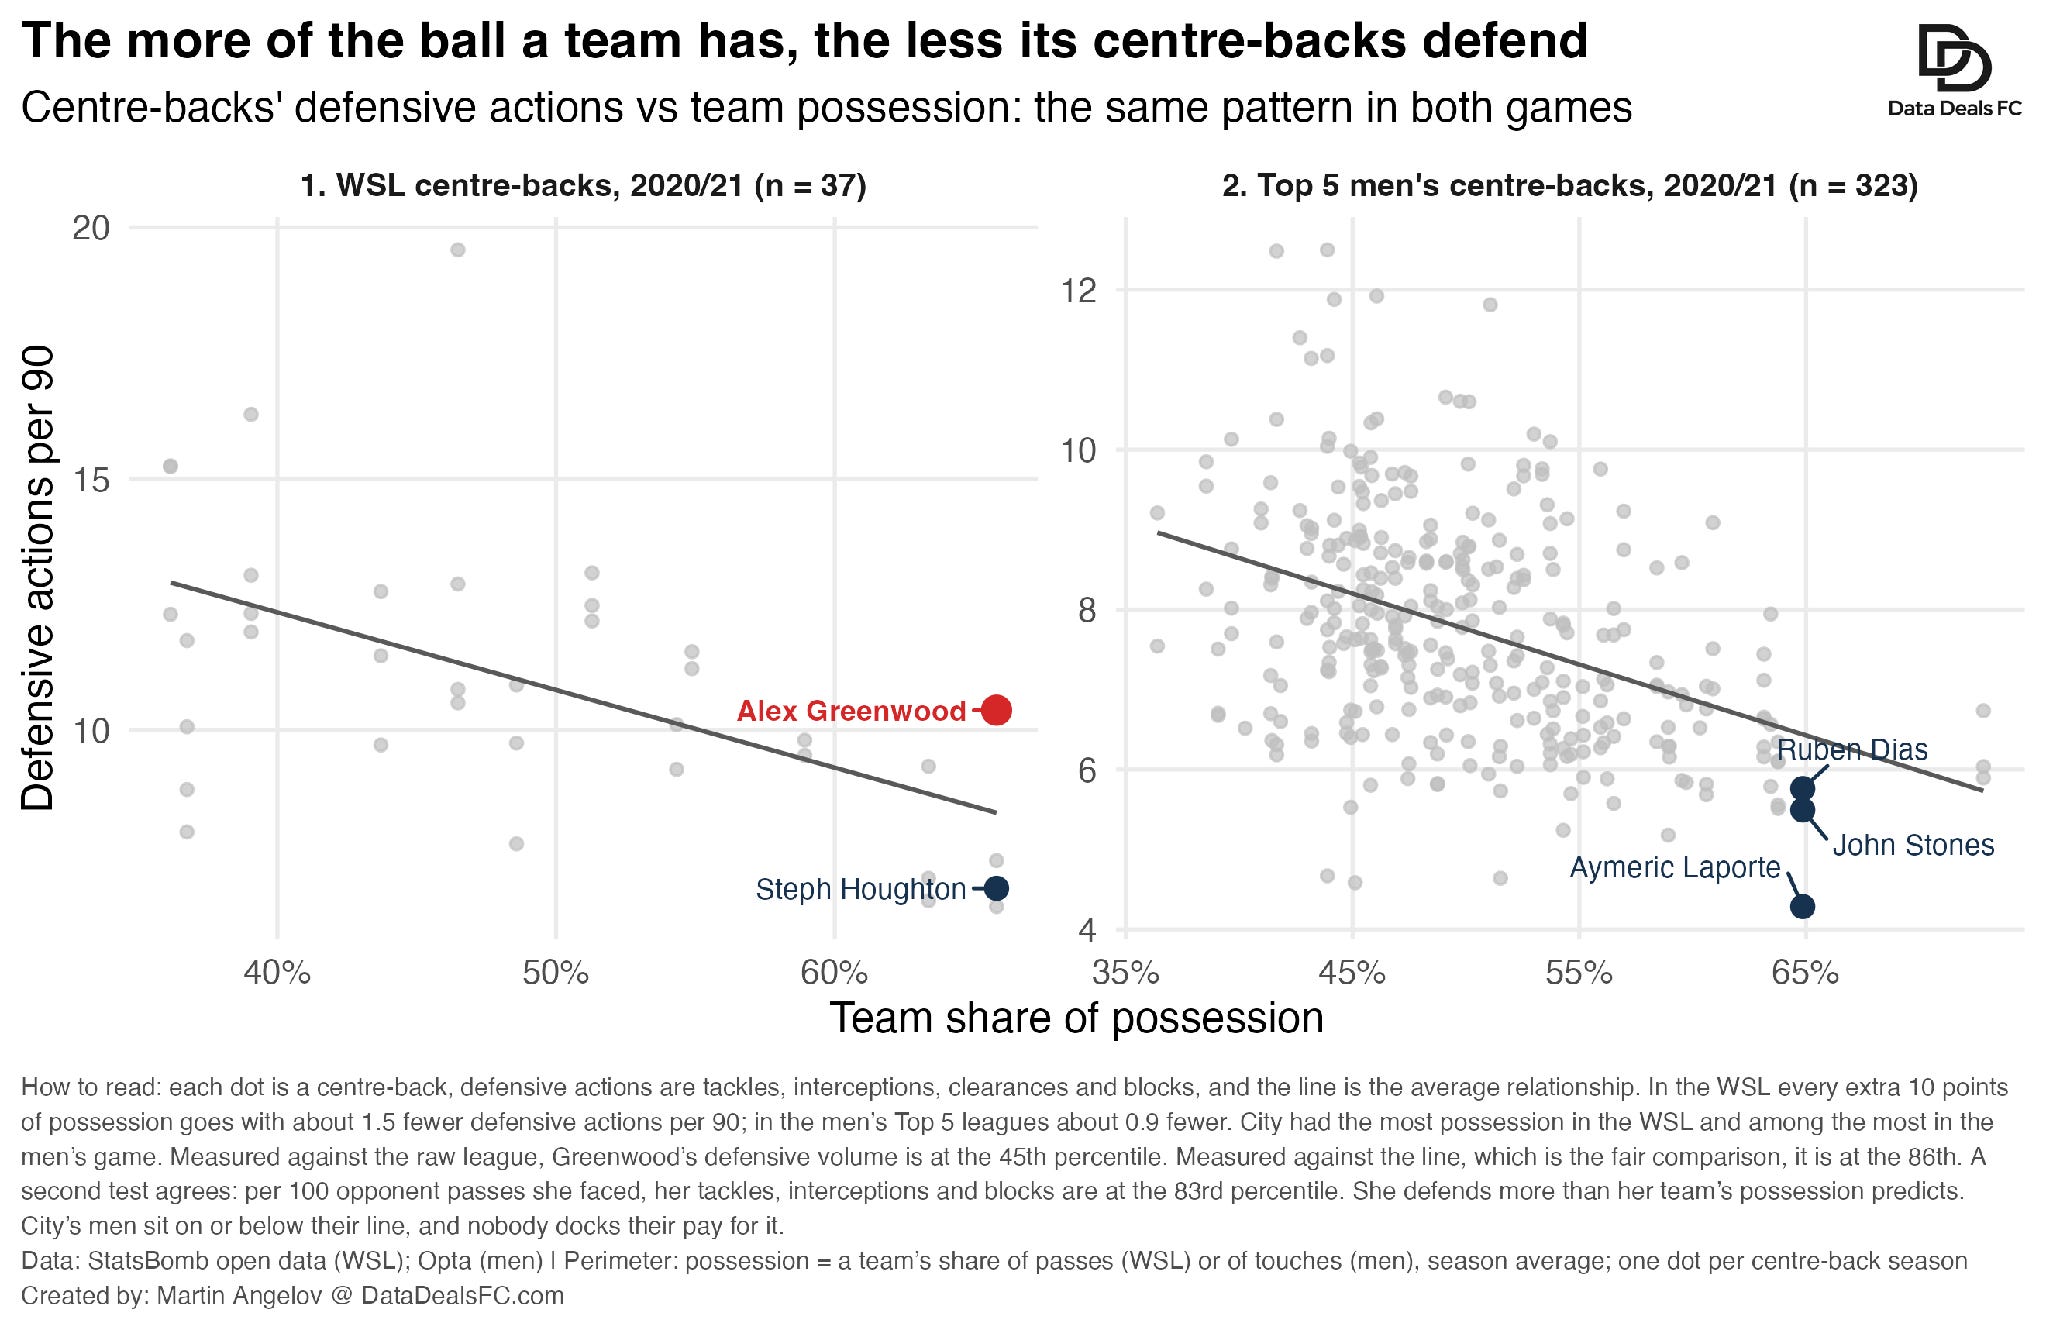
In 2020/21, City had 66% of the ball. Across WSL centre backs, every extra 10 percentage points of possession is associated with roughly 1.5 fewer defensive actions per 90. Against all WSL centre-backs she looks average: 45th percentile. Adjust for how much possession City have and suddenly she’s 86th.
Great, so what have we established so far? She is an ever-present exceptional chance-creating defender that defends well. So what is she actually worth to City?
4. What’s Greenwood’s value to City?
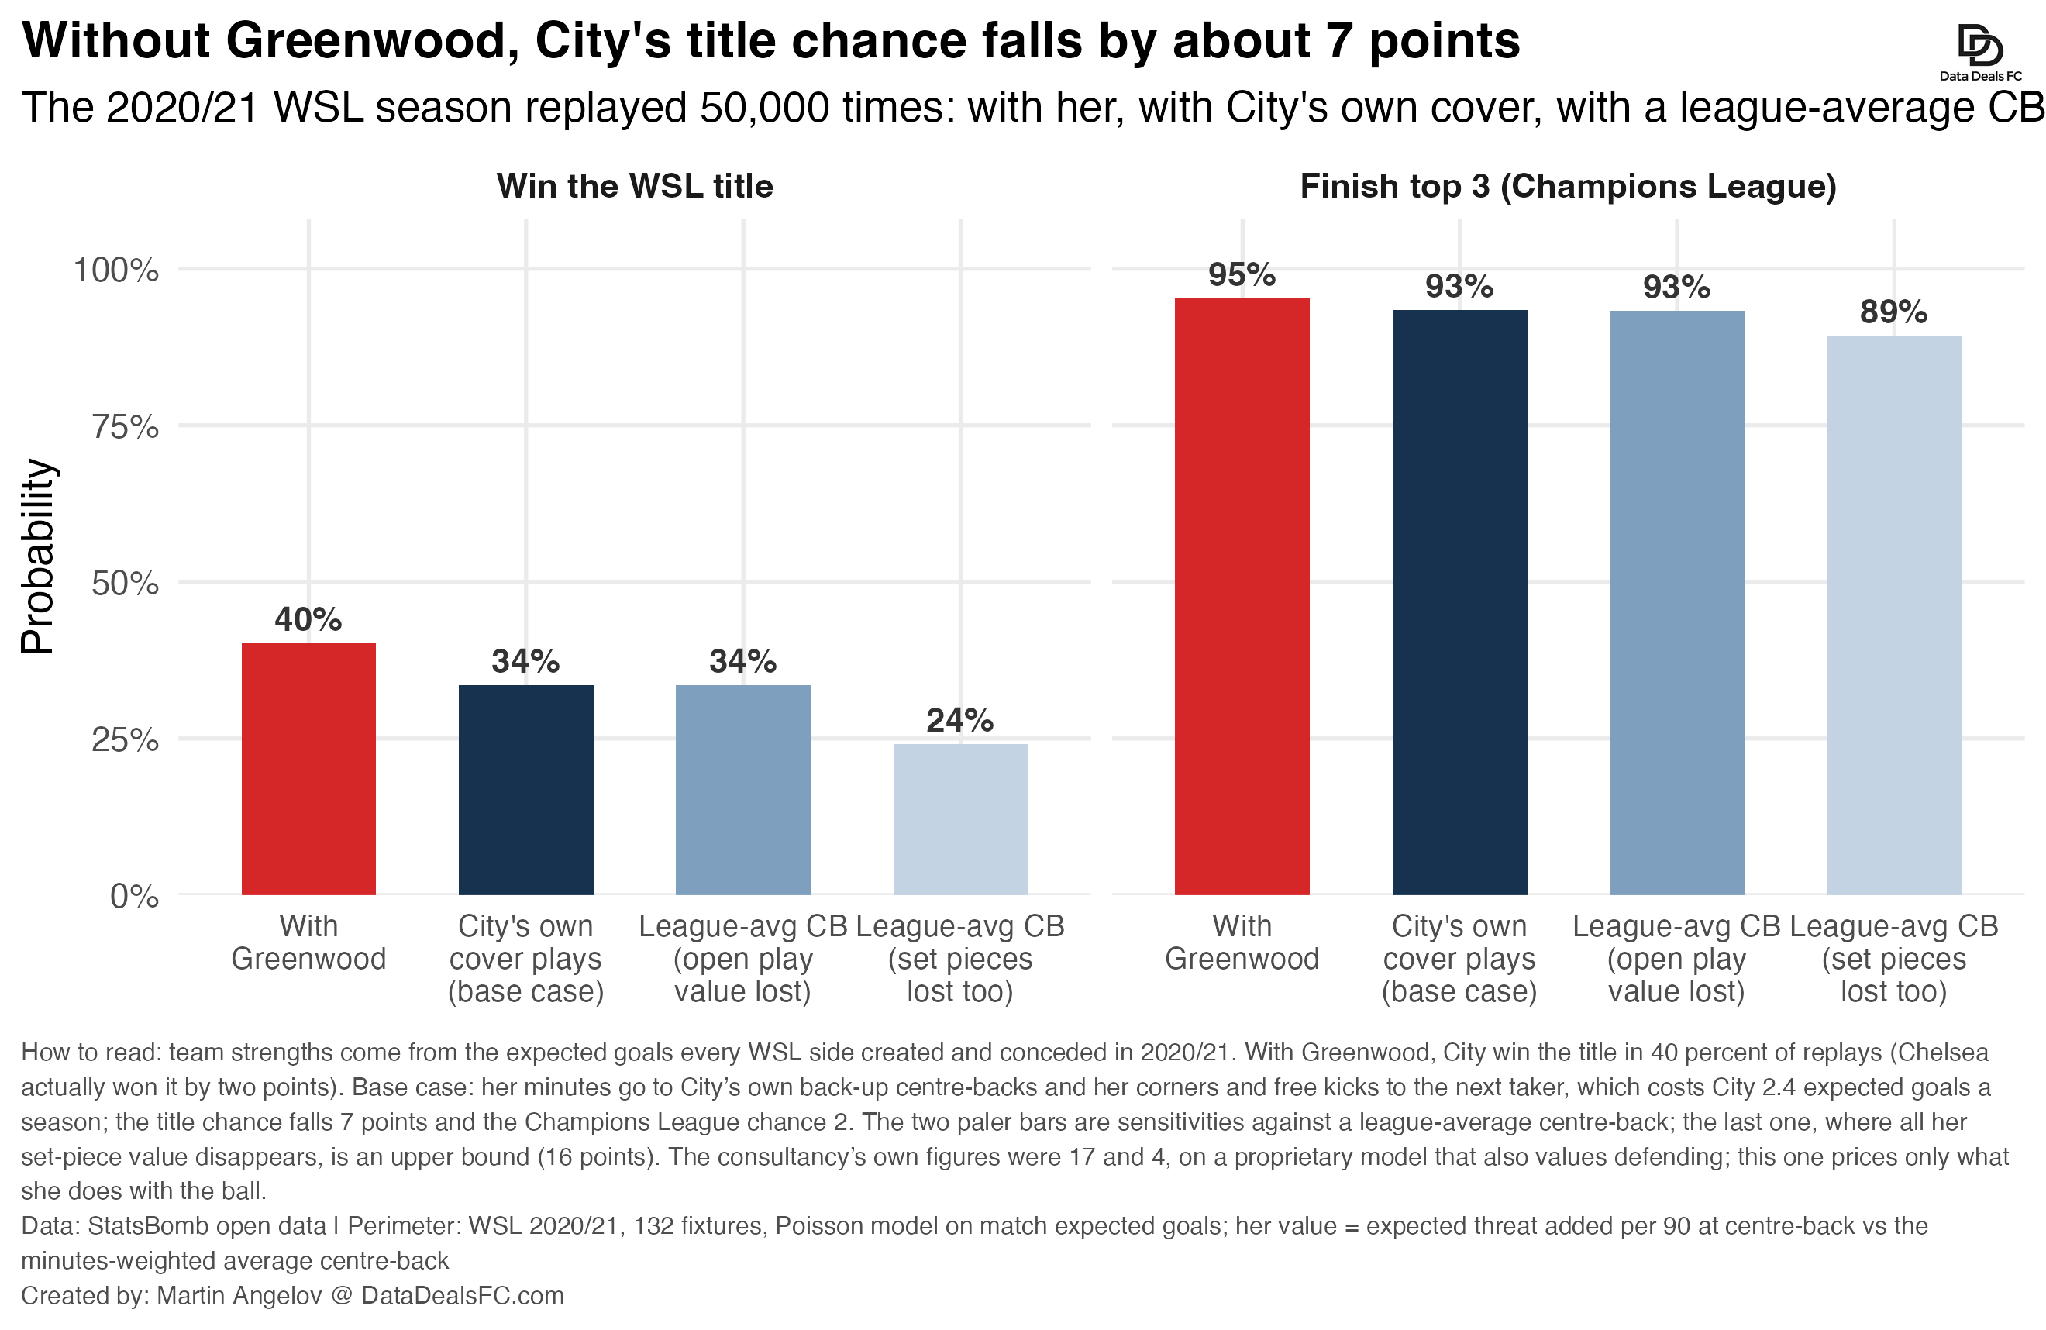
According to the HBS case study, Analytics FC simulated City’s season with and without Greenwood in an attempt to quantify her value to the team’s chances of winning the league. So that’s what I did as well. I rebuilt the 2020/21 WSL season using expected goals and replayed it 50,000 times. Yes, 50,000. (That’s literally one line in R if you know how to code, or know how to politely ask Claude Code.)
With Greenwood, City win the title in about 40% of my simulations. Replace her with the cover (Dahlkemper, Bonner, Morgan) they actually had and it falls to 34%.
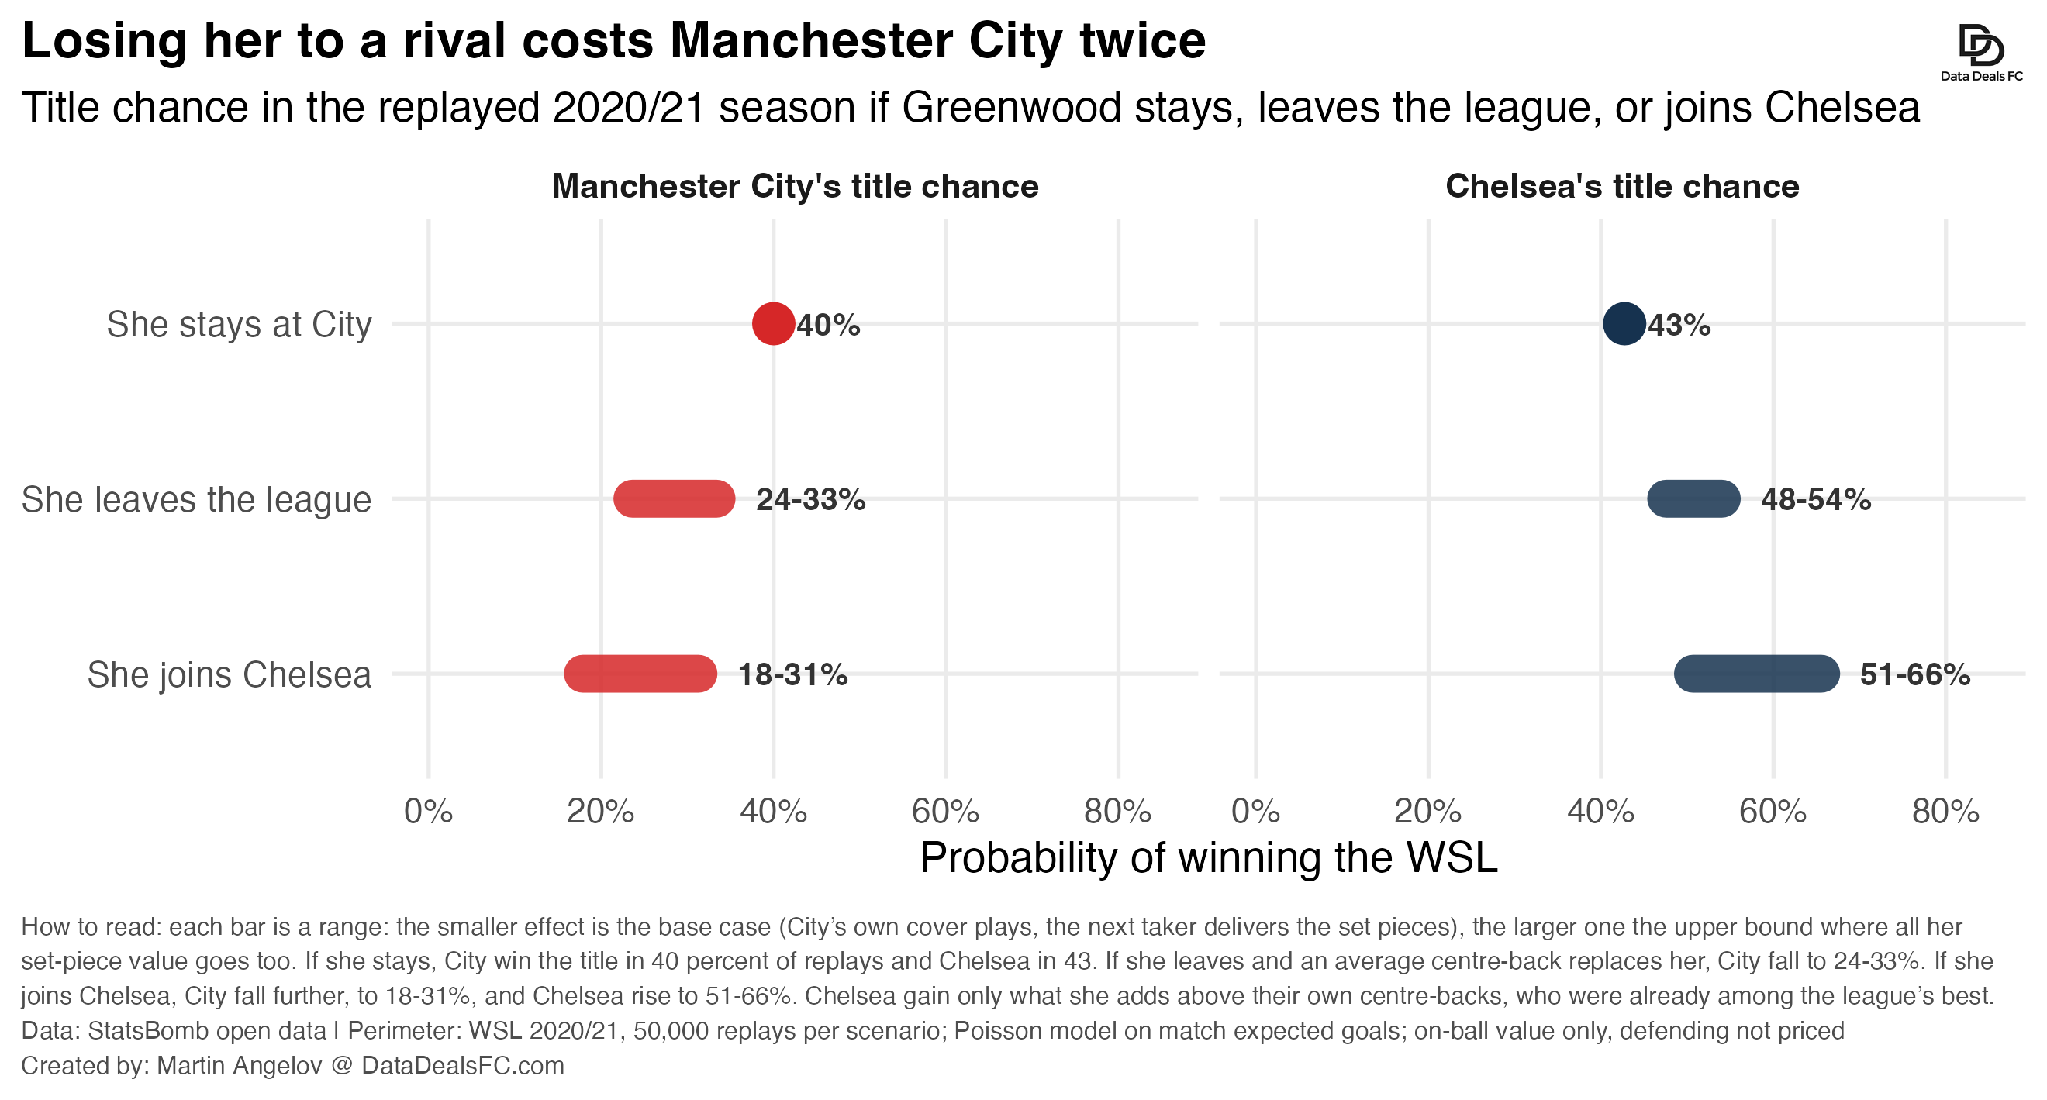
Now what if she joins a rival? Put her at Chelsea and City falls further, while Chelsea moves the other way. That makes sense.
5. Could Greenwood actually leave?
Simulations are all fun and games. But was the threat of her joining a rival real? Well, let’s see which teams actually used their center backs in the same way City used theirs. It turns out that Chelsea and Arsenal were indeed the closest fits, and by some distance.
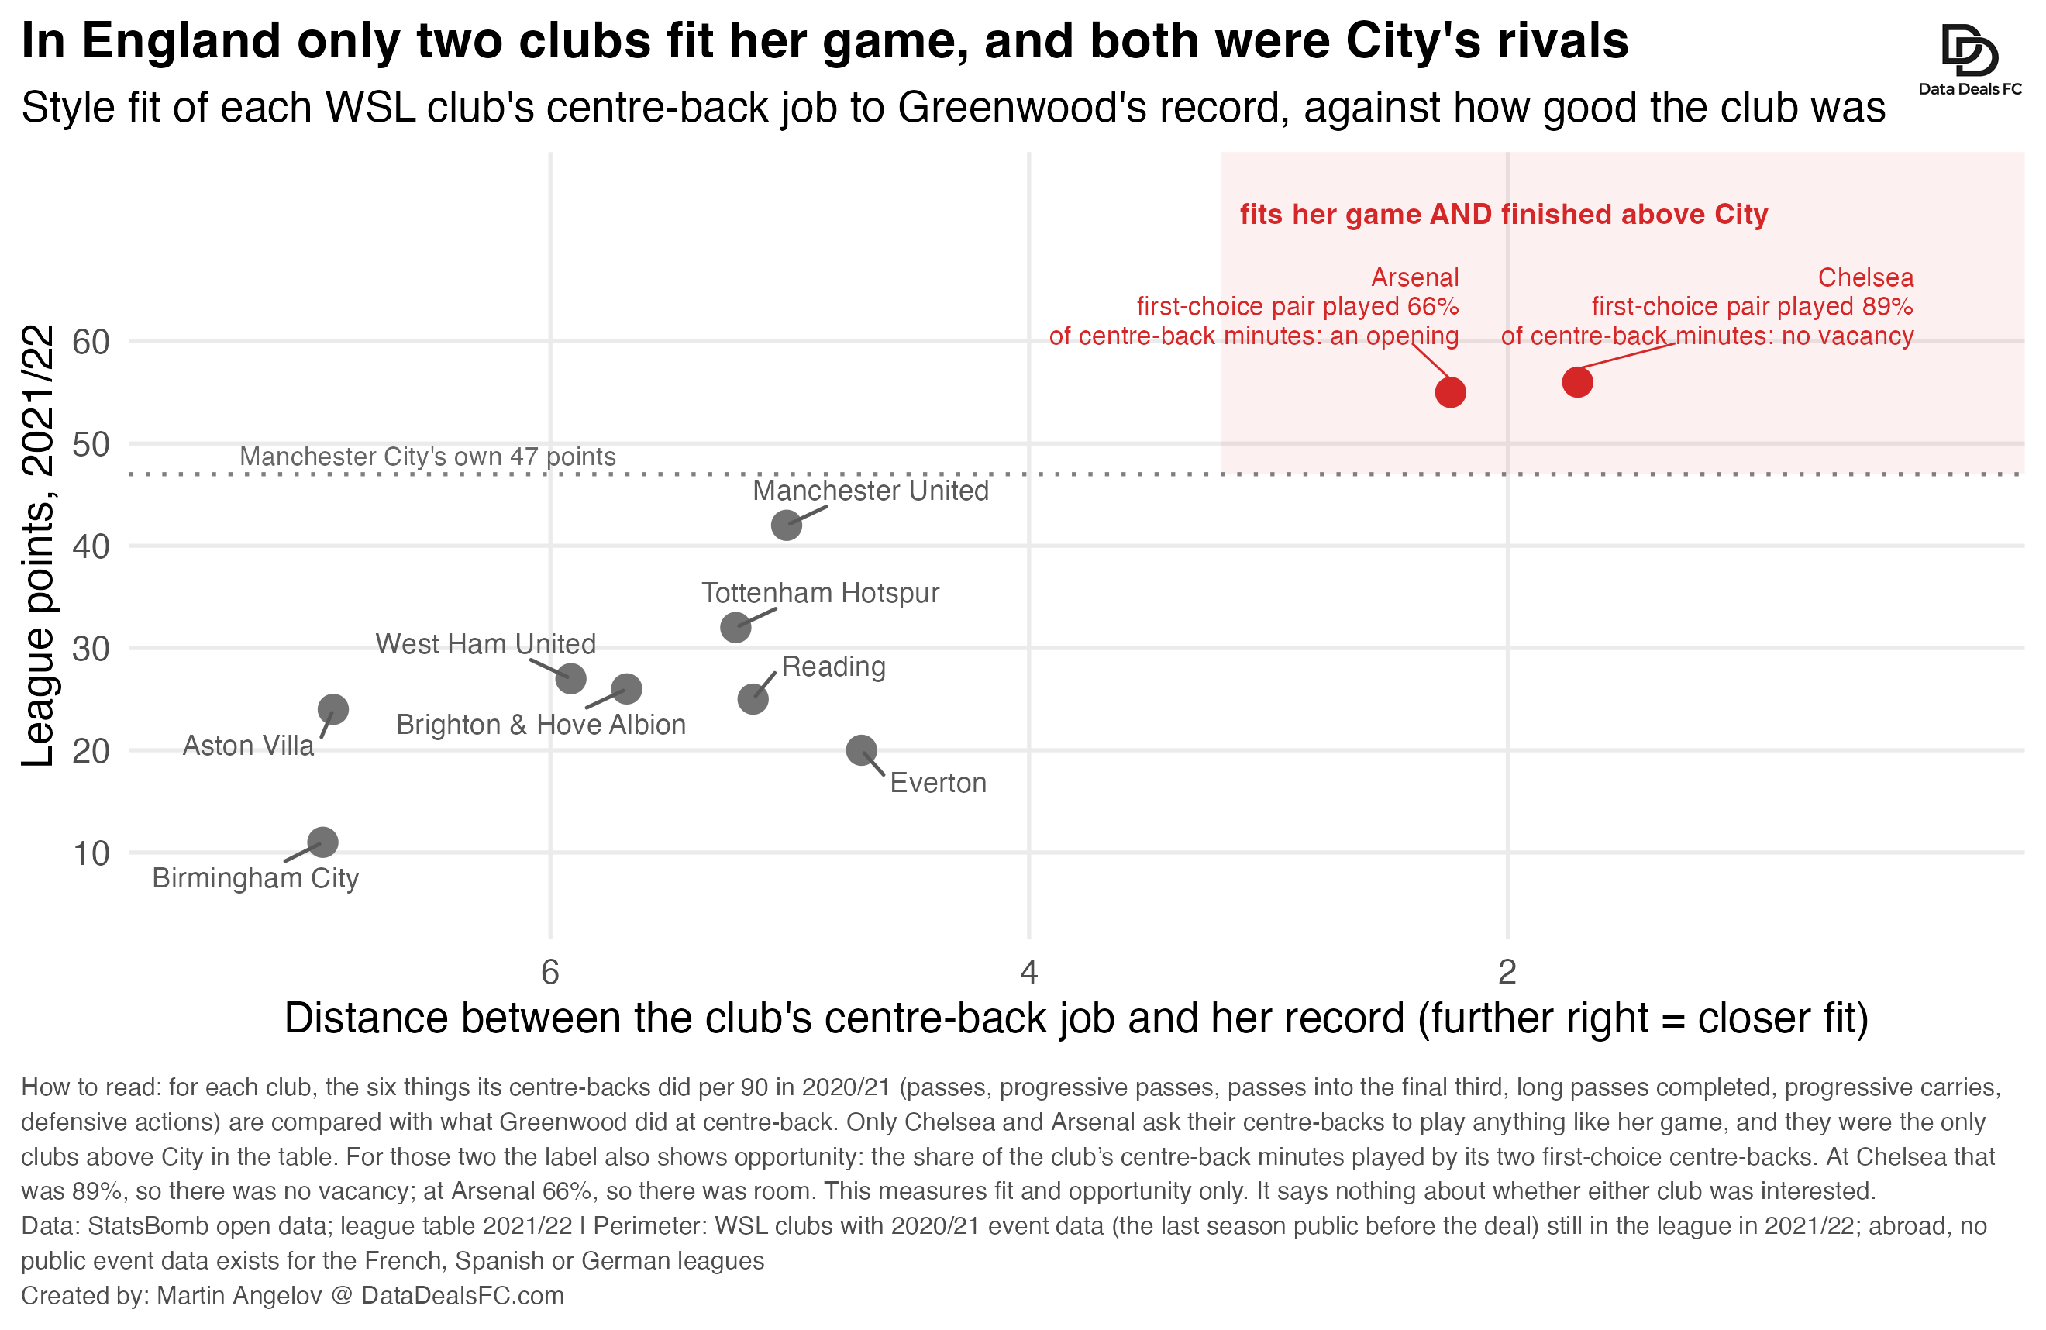
So her outside options were real. I don’t know if Arsenal or Chelsea actually wanted her. That’s not really the point. The point is that
Greenwood had realistic places to go if City said no.
Which brings us to the central question.
6. How do you price a woman footballer?
Well, you bring Virgil van Dijk. Obviously. (True story as per the HBS case study).
At the time, data on women football was barely existent. I mean it still is non-existznt today, what’s left four years ago. So considering the lack of any meaningful public wages or fees in the women football market, her consultants turned to the men’s game.
They compared her with elite male centre backs by asking how far each player stood above the average defender in his or her own competition.
On my simple on-ball index, Greenwood stood at 1.59 standard deviations (SD) above the average WSL center back. For comparison, Van Dijk (which Analytics FC used), stood at 0.97 above the average Premier league defender (2019/20) - we’re talking world-class title-winning Van Dijk.
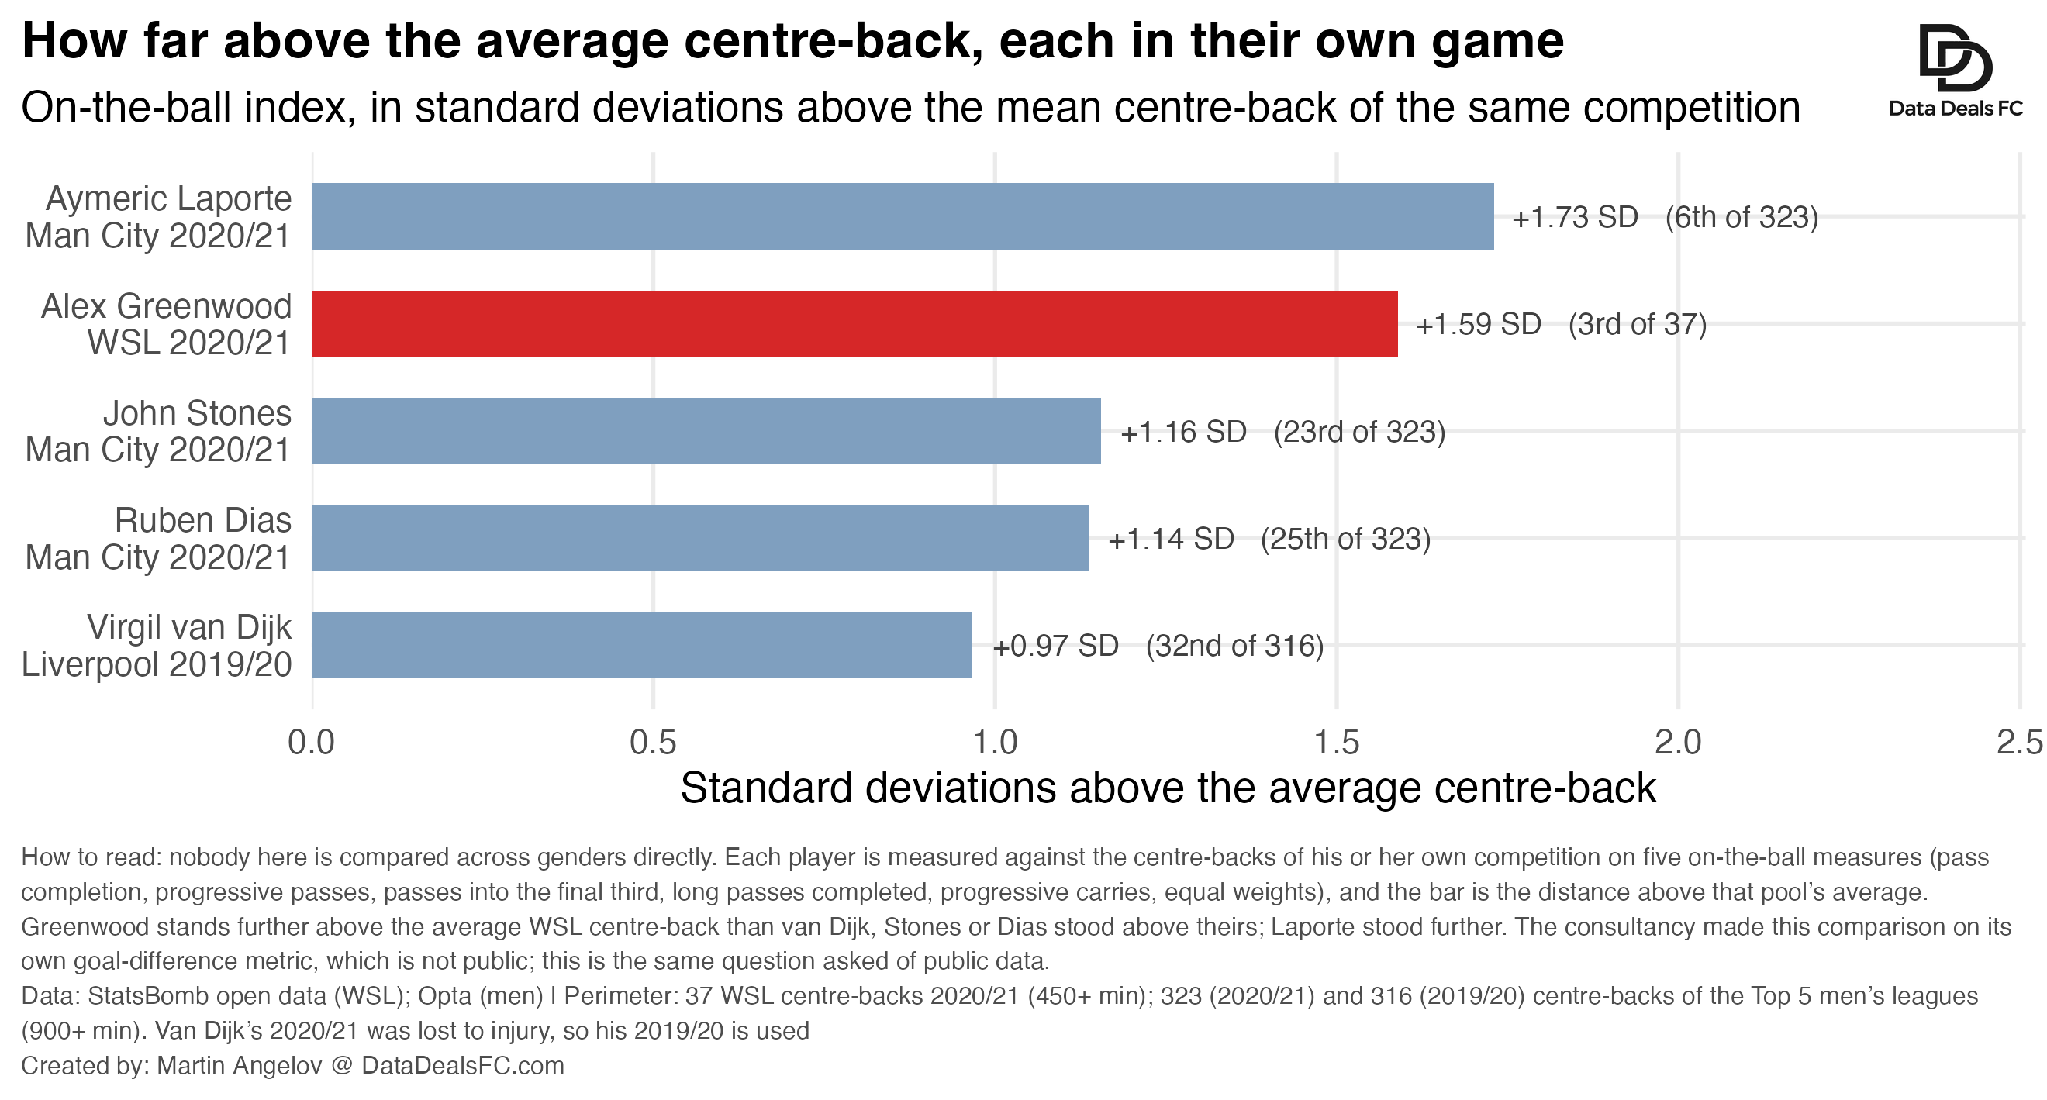
You don’t need to be a statistician here. Greenwood stood miles above the average defender in her league. Van Dijk did the same in his.
And yet, when you show the few scarce wage data points, you see the discrepancy. In 2021/22, estimated annual wages were roughly £11.4M for van Dijk.
Nobody was asking City to pay Greenwood £11M a year. Obviously.
But get this. City Women’s turnover was £4.1M and the league’s wage cap allowed 40% of turnover to go to player pay (that’s £1.6M). Or in other words,
Around three in ten defenders in the men’s big five leagues earned more on their own than City were allowed to spend on the entire women’s squad (£1.6M).
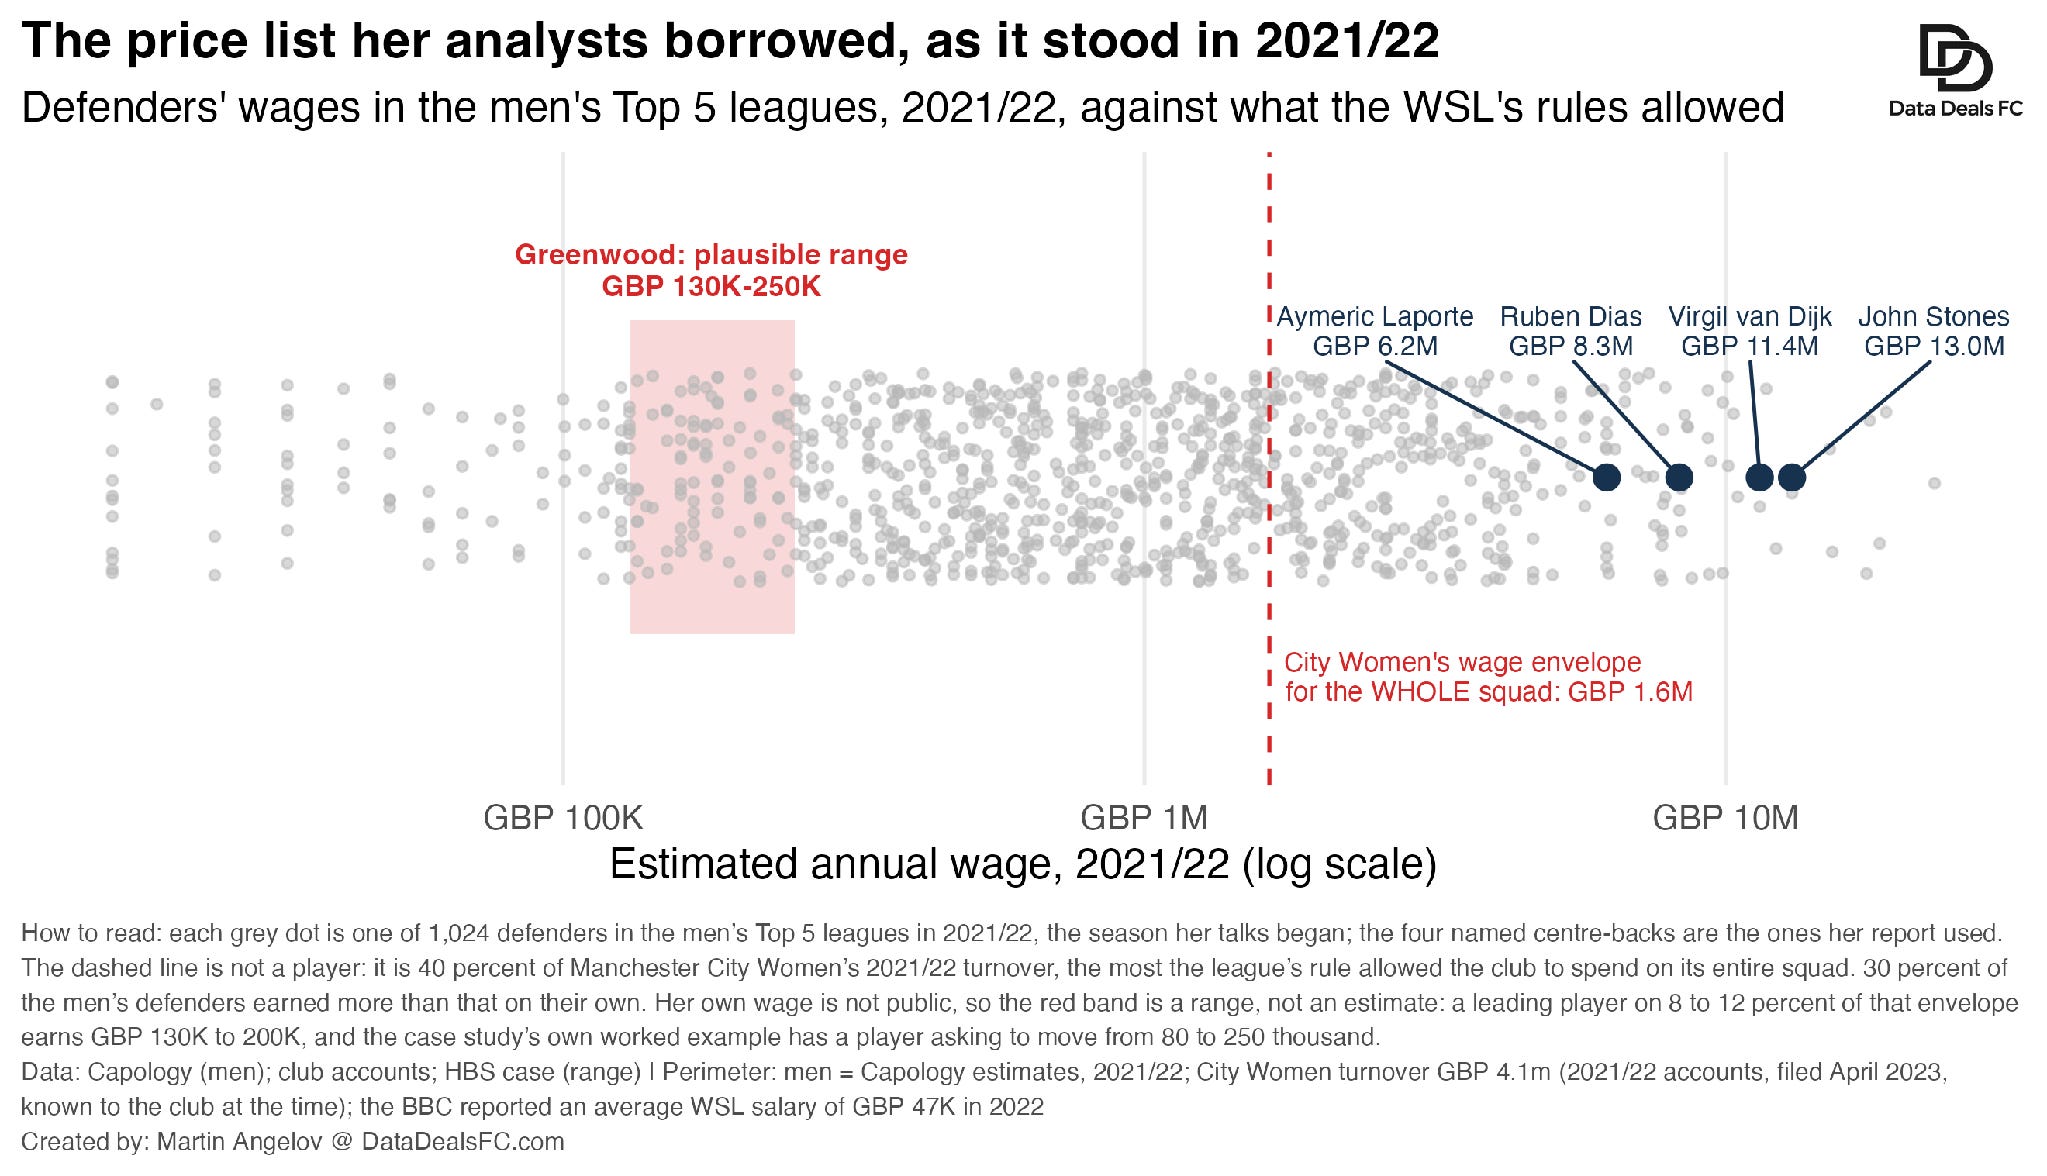
So the van Dijk comparison was never ‘pay me van Dijk money’. It was:
If this level of relative excellence is worth elite money in one of your teams, what is it worth in the other?
That’s much harder question to brush away with ‘we don’t pay women that much’.
7. The women’s football was (slowly but steadily) growing
And there was one last argument: women’s football was growing fast.
The consultancy reportedly showed revenues growing 30% to 50% a year while wages lagged. And the big stuff had barely landed in those accounts yet: a new broadcast deal, England winning Euro 2022 at Wembley, record attendances.
The public accounts available at the time only went to 2020/21, but even those already showed the direction.
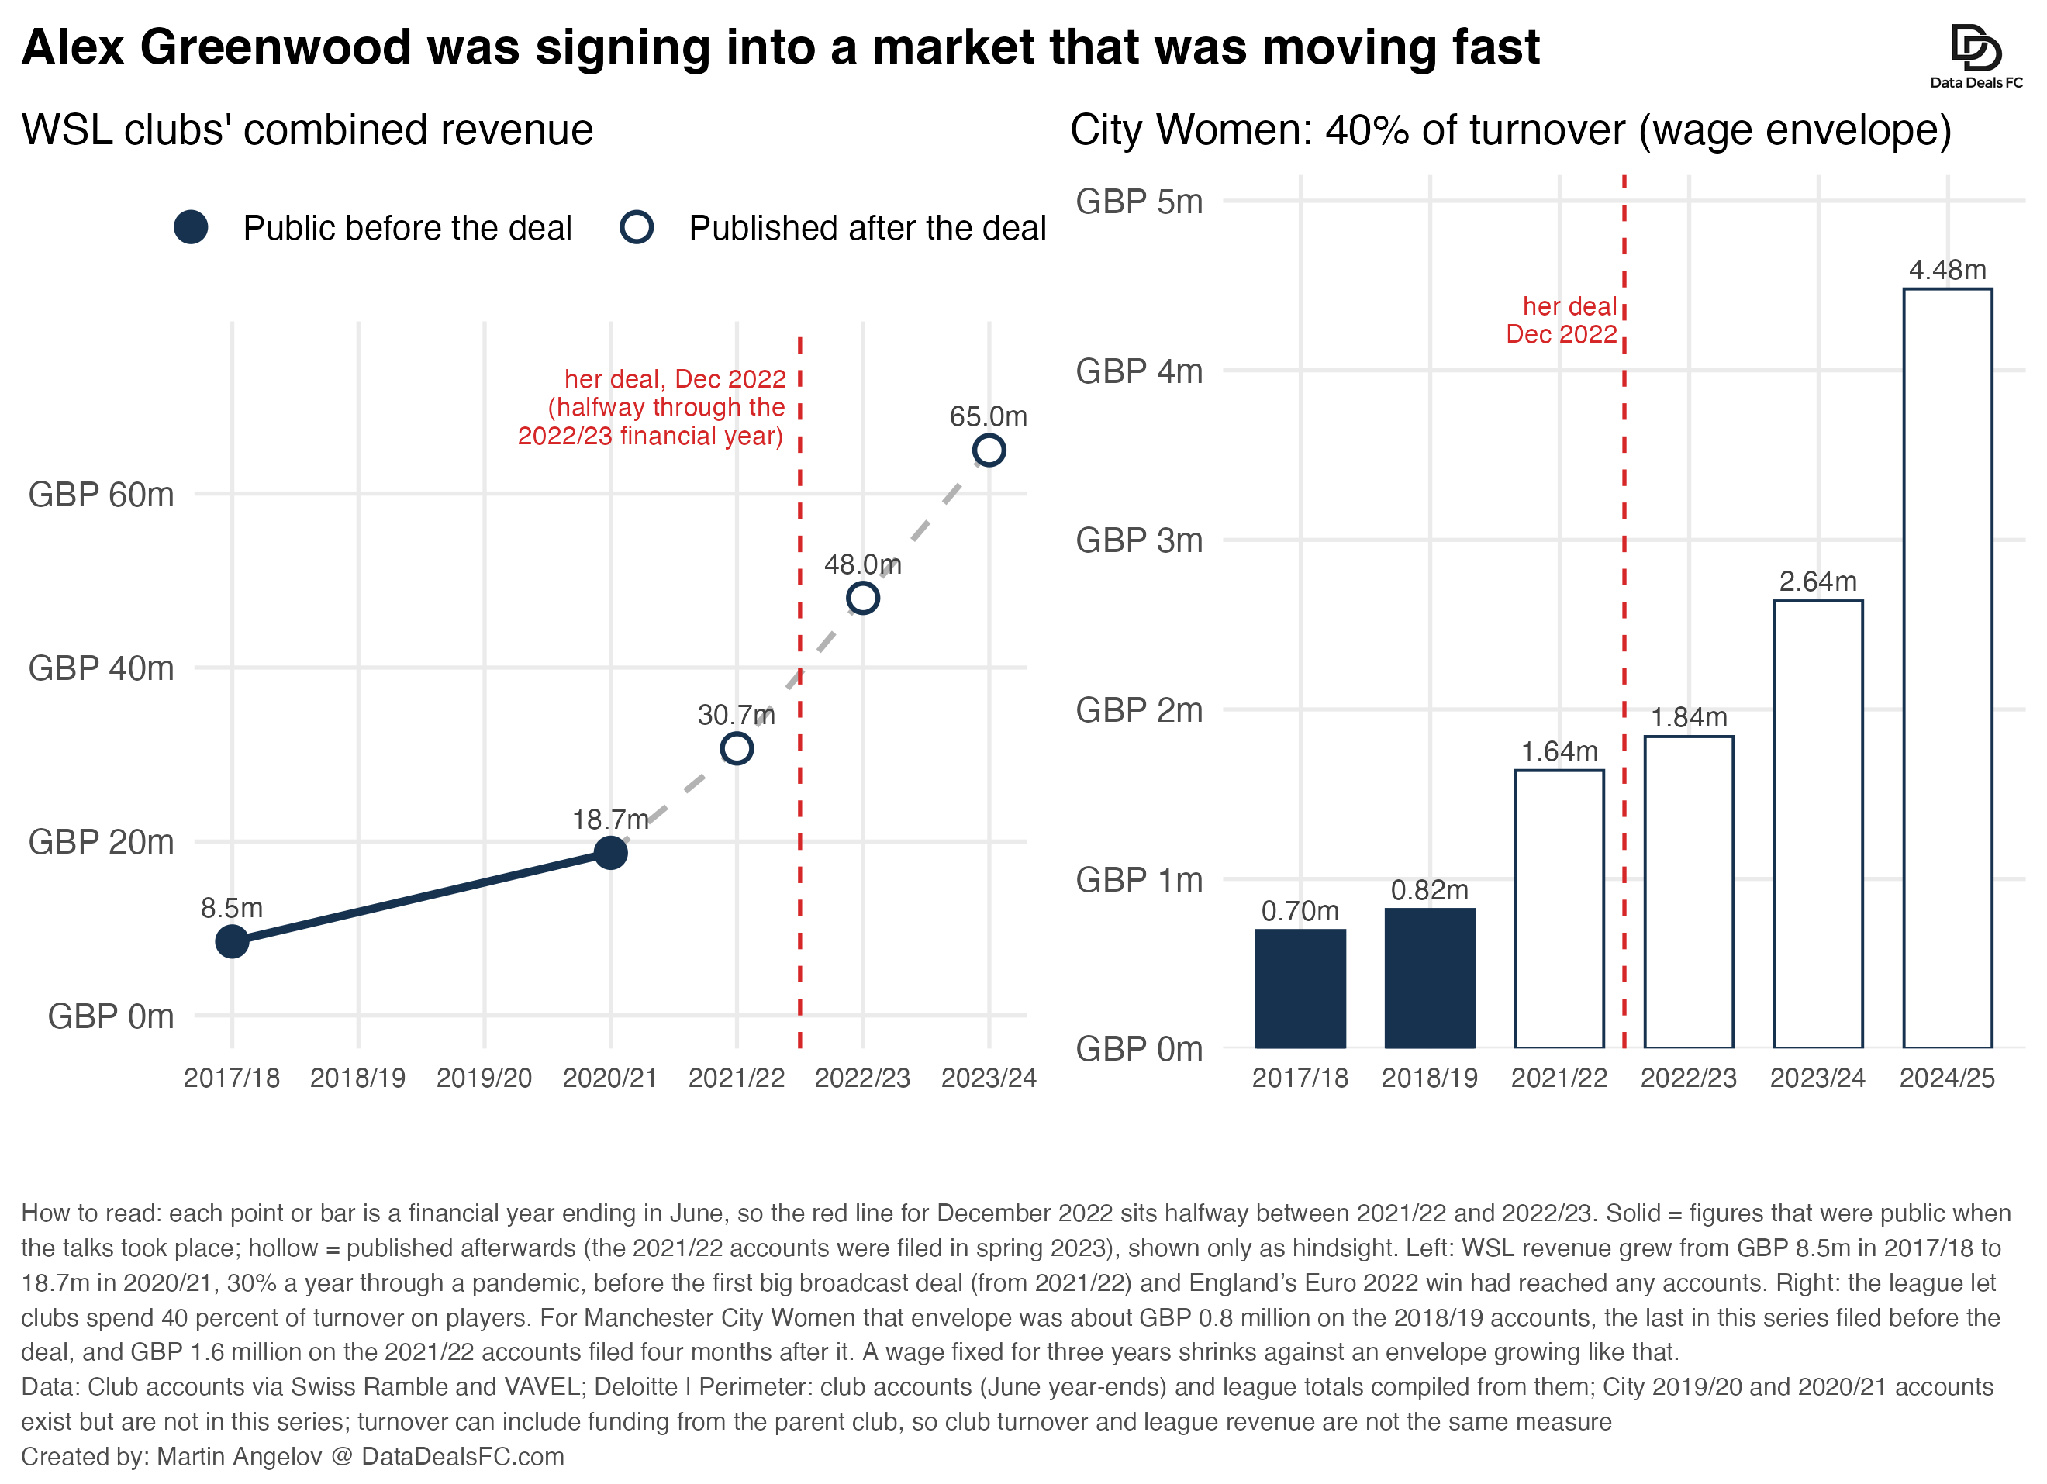
Combined WSL club revenue had risen from £8.5M in 2017/18 to £18.7M in 2020/21, roughly 30% a year. And that’s through a pandemic.
So a three-year flat salary had a problem. Maybe it looked fair in 2022. By 2025? Quite possibly not.
So, how much did she actually get?
Nobody published the exact number. All we know is that the new deal was “significantly more lucrative”.
So here’s my best back-of-the-envelope estimate.
City Women’s wage envelope was about £1.6M. Assume a star player takes 10-12% of that, as leading players typically do in a squad this size, and you get roughly £160K-200K a year. For a sanity check, Leah Williamson was reported at around £200K at Arsenal at the time, and England’s first-choice centre-back belongs in that bracket.
Work backwards from Greenwood’s current estimated pay (about £220K, on Football Manager’s numbers), and a 2022 deal in the region of £180K a year looks plausible.
That would imply a raise of roughly 50%, from perhaps £120K when she joined City.
Not bad. And she kept delivering.
She played 91% and 88% of City’s league minutes in the next two seasons, returned from a knee injury to start every game of England’s Euro 2025 win, and signed another City extension in 2025.
Today, Football Manager’s estimates put her among City’s best-paid players.
The defender.
Three years after: “we don’t pay women that much.”
I mean it’s still not that much compared to the men’s game. But then again the prize money and TV rights are not really comparable, aren’t they.
Boom — that was the Alex Greenwood story: how data helped her put a price on her value in a market that barely had one.
I hope you enjoyed this one as much as I enjoyed putting it together.
Thanks for reading until the end.
Talk soon,
Martin
PS. If you liked this piece chances are you’ll also enjoy how Kevin De Bruyne himself used data scientists to secure a 30% increase at 29, or how Man City used a magical data science technique to find his replacement or what Bruno Fernandes’ data science team likely argued in his ongoing negotiations with United.
P.P.S. If a tailor-made report (such as the one I did on Kai Havertz’s contract negotiation) is what interests you (including on women’s football), drop me a line.