


The City Files is a series on the Manchester City verdict and the compensation claims that could follow it.
Part 1: Manchester City’s 115 Charges, Explained in Plain English
Part 2: The £35M Playbook: How Burnley Made Everton Pay, and How City’s Rivals Could Do the Same
Part 3: What Arsenal Could Claim (you are here)
Part 4: What Liverpool Could Claim
Part 5: What Manchester United Could Claim
Hi friends,
In Part 2 of the series, we took apart the only decided case in which one Premier League club was made to pay another for breaking the financial rules: Burnley v Everton, £35M.
We ended with a six-step playbook.
Start from a proven breach.
Build the “what if” world.
Turn the money into points.
Turn the points into a league position.
Price what was lost.
Add interest.
Today I run that playbook for Arsenal in an attempt to quantify the damages amount they would be claiming.
I am going to play both sides. First what Arsenal’s economists would argue, then what City’s would say back, step by step, with the numbers.
Two warnings before we start.
The first is that this is my reconstruction. Nobody has filed anything, and I have no inside knowledge of what either club is planning.
The second matters more. The Commission found that City’s income was overstated by more than £830M over nine seasons, but the season-by-season amounts sit in appendices that have not been published. So wherever I need a number for a single season, I have had to assume one. I will say so each time, and I will show you how much the answer moves when the assumption changes.
Let’s get into it.
First question: which seasons?
A compensation claim needs a specific loss.
“City had an unfair advantage for a decade” is a complaint.
“City’s breach cost us this particular place, in this season, worth this much” is a claim.
So the first job is to look for the seasons where City finished directly between Arsenal and something valuable.
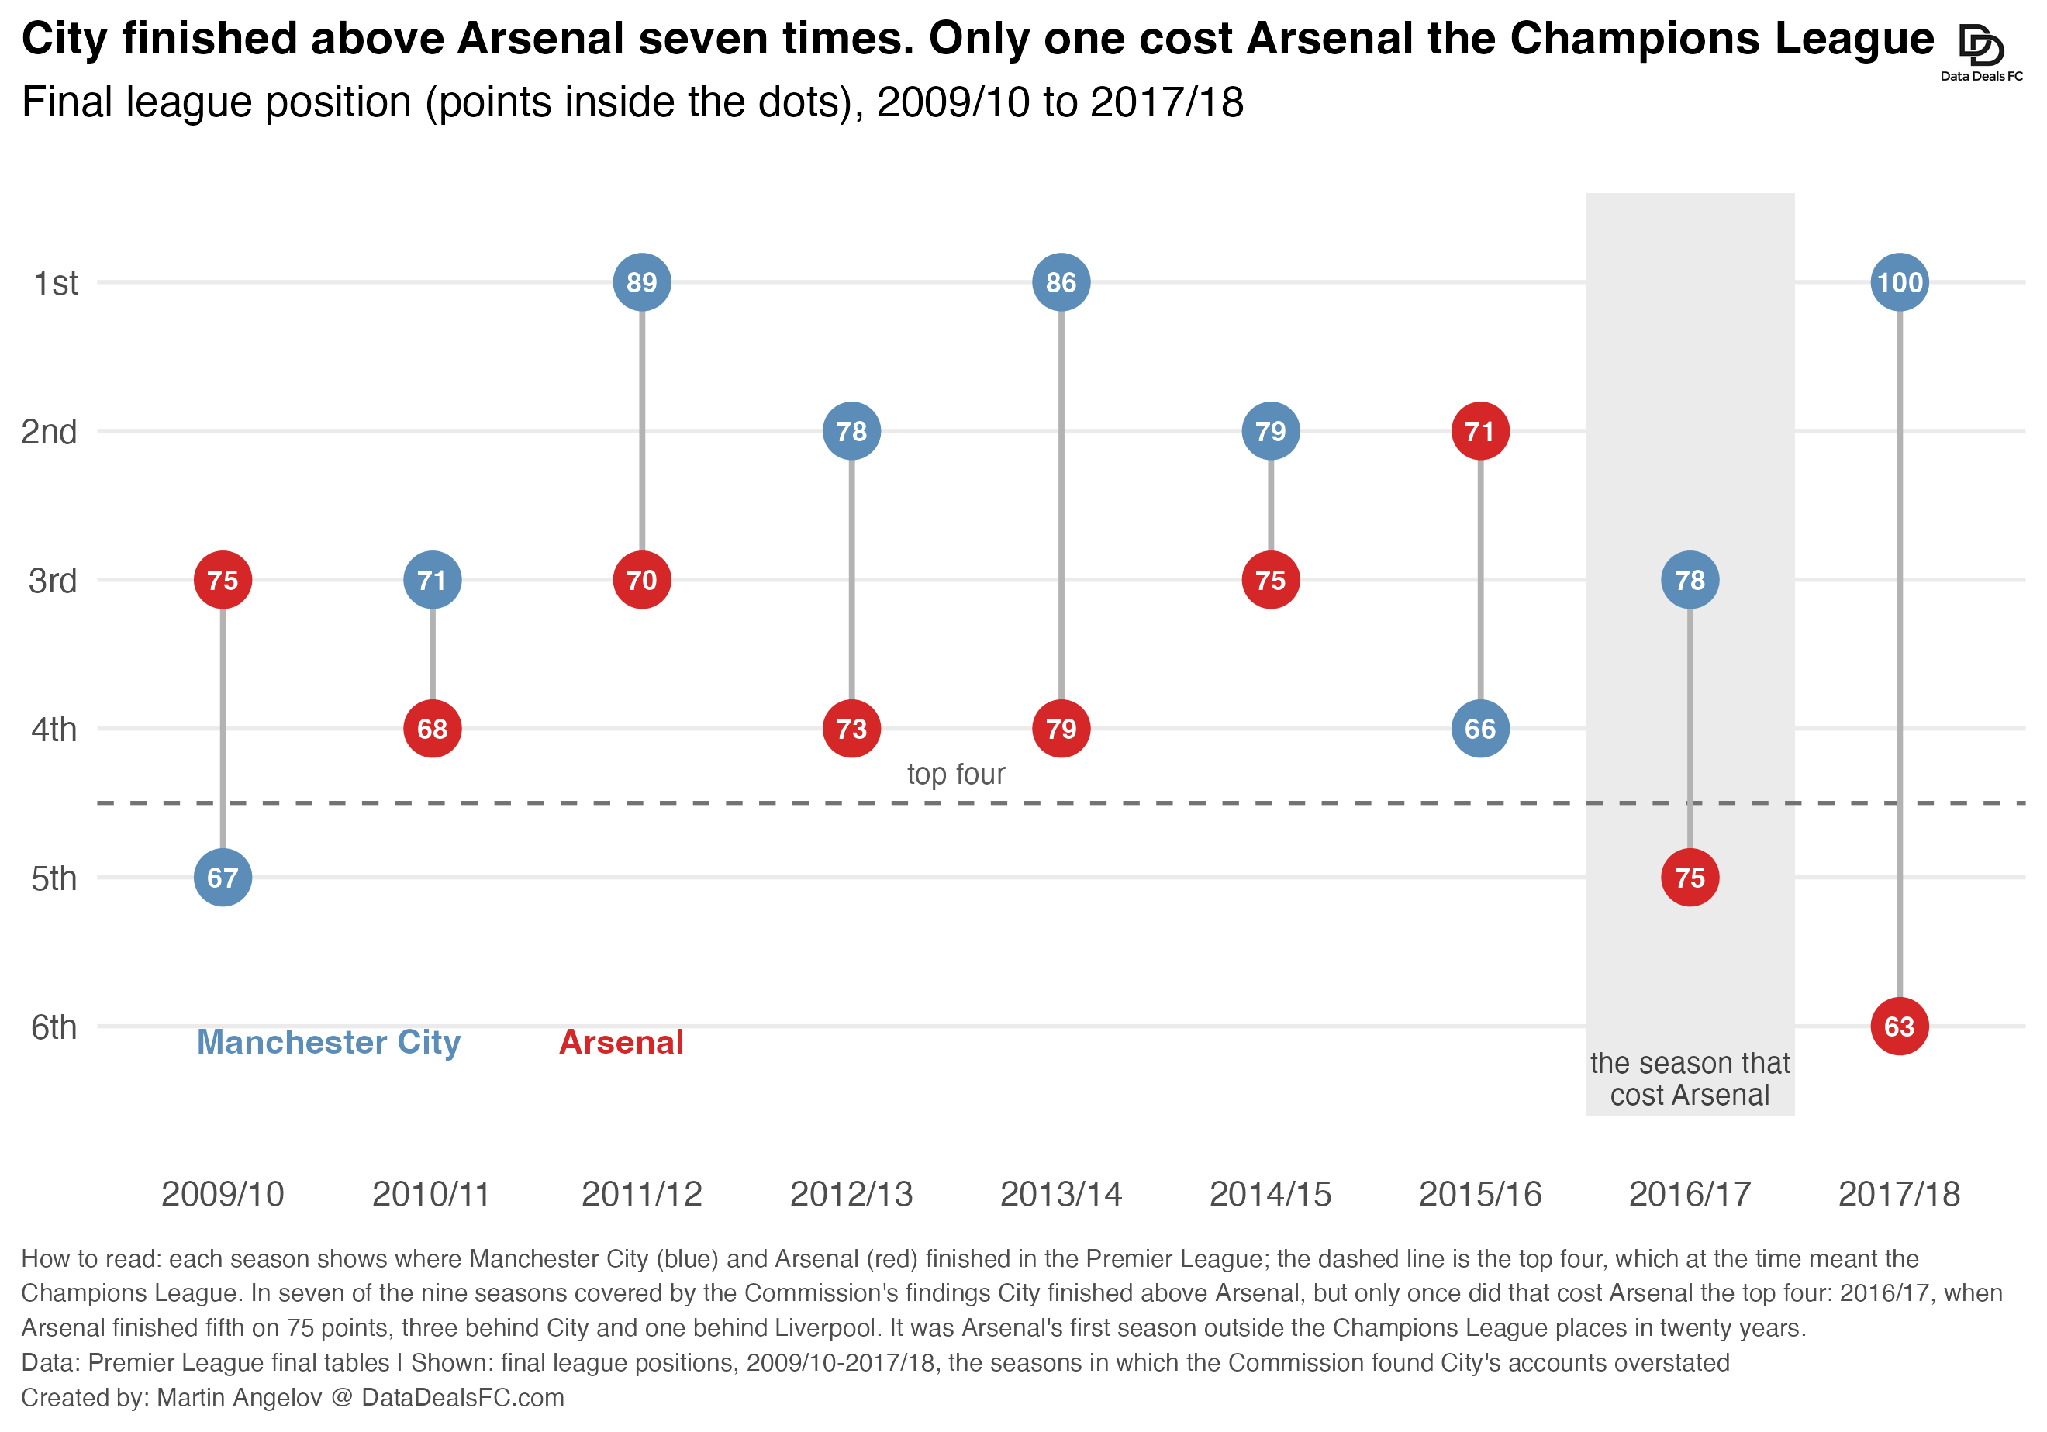
In the nine seasons covered by the Commission’s findings, 2009/10 to 2017/18, City finished above Arsenal seven times. But in six of those seven, it made little difference to Arsenal: they were in the top four anyway, and moving from fourth to third is worth a couple of million pounds in prize money.
One season is different.
In 2016/17 Arsenal finished fifth on 75 points. City were third on 78. Liverpool were fourth on 76. Arsenal missed the Champions League for the first time in twenty years, by one point.
Two things make this the season to build a claim on.
It is the only one in the period where City’s position cost Arsenal a place worth tens of millions.
And it is a season in which the Commission found City in breach of the Premier League’s spending limit, the Profitability and Sustainability Rules (PSR). That is exactly the kind of breach Everton committed in the season Burnley went down.
What about the two titles Arsenal lost to City, by five points in 2022/23 and by two in 2023/24? Those are the ones supporters care about most. But the financial findings stop at 2017/18. To claim for 2023 or 2024, Arsenal would have to argue that money disguised before 2018 was still winning matches five years later. I think that is a different (and harder) case, and I leave it aside here.
So: 2016/17, fifth place, three points behind City.
Step 1: The Proven Breach
In Burnley’s case this step was short. The league had already established that Everton overspent by £19.5M, and that number was binding.
For Arsenal, the breach is established too. What is missing is the number.
We know the total: more than £830M of income that should have been recorded as owner funding, across nine seasons. We know City breached the PSR in 2015/16, 2016/17 and 2017/18 “by a very substantial amount”. We do not know what “very substantial” means in pounds for 2016/17.
And the right number is not obvious even in principle. Remember what Everton’s £19.5M was: the amount by which its losses exceeded the limit. It was not the club’s total spending, and not its total losses. So for City, there are at least three candidates.
The overstated income of that one season. If the £830M fell evenly across the nine seasons, that is about £92M for 2016/17. If it followed the growth of City’s reported commercial income, about £125M. (Both profiles are my assumptions.)
The excess over the spending limit. The PSR test looks at three seasons together and allows a loss of £105M. City reported a combined profit of £30M for 2014/15 to 2016/17. Take out three seasons of overstated income and that becomes a loss of roughly £247M to £314M. The excess over £105M is then £142M to £209M. But clubs can deduct spending on the academy, the women’s team, community work and infrastructure before the test is applied. I do not know City’s deductions. If I assume £40M a year, the excess falls to somewhere between £22M and £89M.
Everything in the three-year window. Arsenal’s most aggressive version: all the disguised funding of those three seasons built the squad that played in 2016/17. That is £277M to £344M.
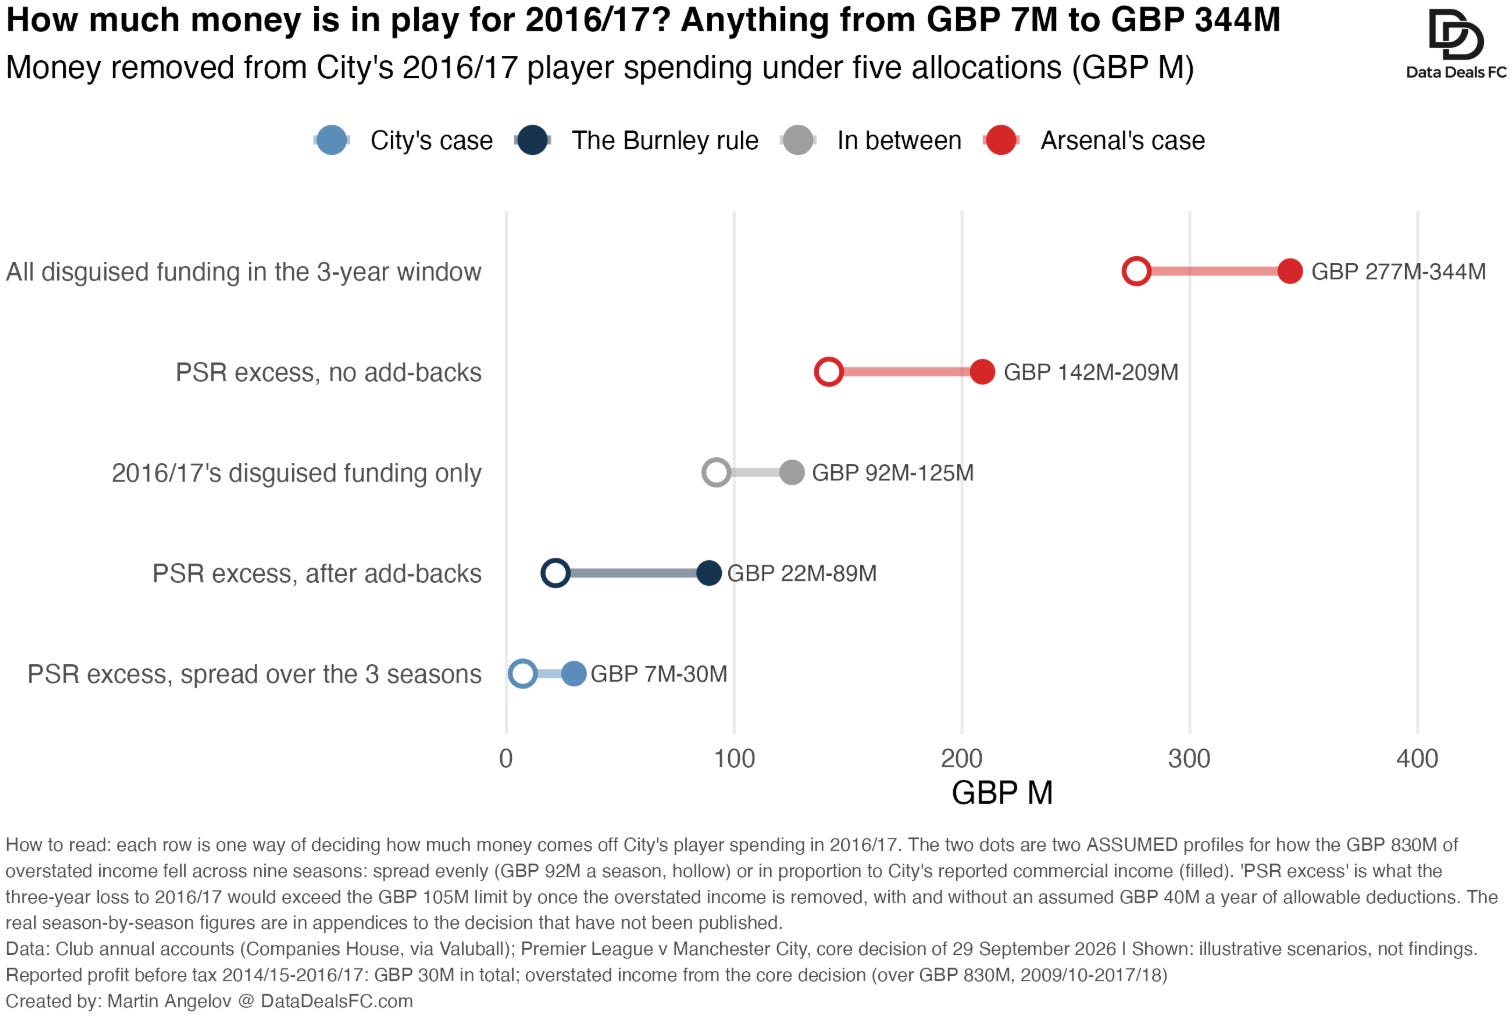
So the money in play for 2016/17 could be as little as £22M or as much as £344M. That is not a satisfying answer, and it is the single biggest uncertainty in this piece. It will narrow sharply the day the appendices are published.
What Arsenal would argue: follow Burnley. There, the whole excess over the limit, built up over four years, was counted against the final season, because “the benefit of the overspend is cumulative”.
What City would argue: exactly what Everton’s expert argued. Spread the excess across the seasons of the assessment period, so that only a third of it lands on 2016/17. On my assumptions that would be £7M to £30M. The Commission rejected this for Everton. City would say its facts are different.
Step 2: The “What If” World
The counterfactual is the world in which City complied. What would it have done?
What Arsenal would argue: City would have had to spend less on players. The disguised money was there to fund a squad the rules did not allow. Take it away, and the squad is weaker. This is the conclusion the Commission reached for Everton, and City’s breach is many times larger.
What City would argue: a club with City’s commercial pull would have found the money legitimately. Real sponsors would have paid more over time; the owner could have funded infrastructure and the academy, which the rules allow; players could have been sold at a profit.
There are two problems with City’s version. The Commission found that City would have failed the PSR test in every season even if the sponsorship deals were revalued at a fair market price. And in Burnley v Everton, the test was what the club would “practically and realistically” have done, not the version most convenient for the club being sued. Everton’s owner had turned down a real offer for a player; that sank its “we would have sold someone” argument.
I think Arsenal has the better of this step. But City does not need to win it outright. Every pound it can show would have been raised legitimately is a pound that comes off the number in step 1.
Step 3: Turn The Money Into Points
Now the exchange rate. How many points was each pound worth to City in 2016/17?
In Part 2 we saw that there is no observable exchange rate between pounds and points. The experts have to build one, and the two sides in Burnley’s case built it very differently. I have rebuilt both methods for City.
Arsenal’s method: City’s own rate
This is what Burnley’s experts did and the Commission accepted. Divide City’s points by its player spending (wages plus transfer-fee amortisation), season by season, and average.
In 2016/17 City won 78 points and spent £356M on players: 0.22 points per £1M. Over the three seasons of the PSR window the average is 0.25. Over all nine breach seasons, 0.27. Adjust the earlier seasons for the growth in football spending, as Everton successfully argued should be done, and it falls to about 0.21.
Call it 2.1 to 2.7 points for every £10M.
City’s methods
City’s economists would say a club’s own average rate is the wrong measure for a club at the top. Their argument is diminishing returns: the first £100M turns a relegation side into a mid-table one, but the last £100M at a club already winning most of its matches buys much less. They have three ways of putting a number on that.
The league-wide rate, across every Premier League club: 1.5 points per £10M in 2016/17.
The league rate at City’s level of spending, where each extra pound buys less: 0.7.
A match-by-match model of relative spending, the approach Everton’s expert took: also 0.7.
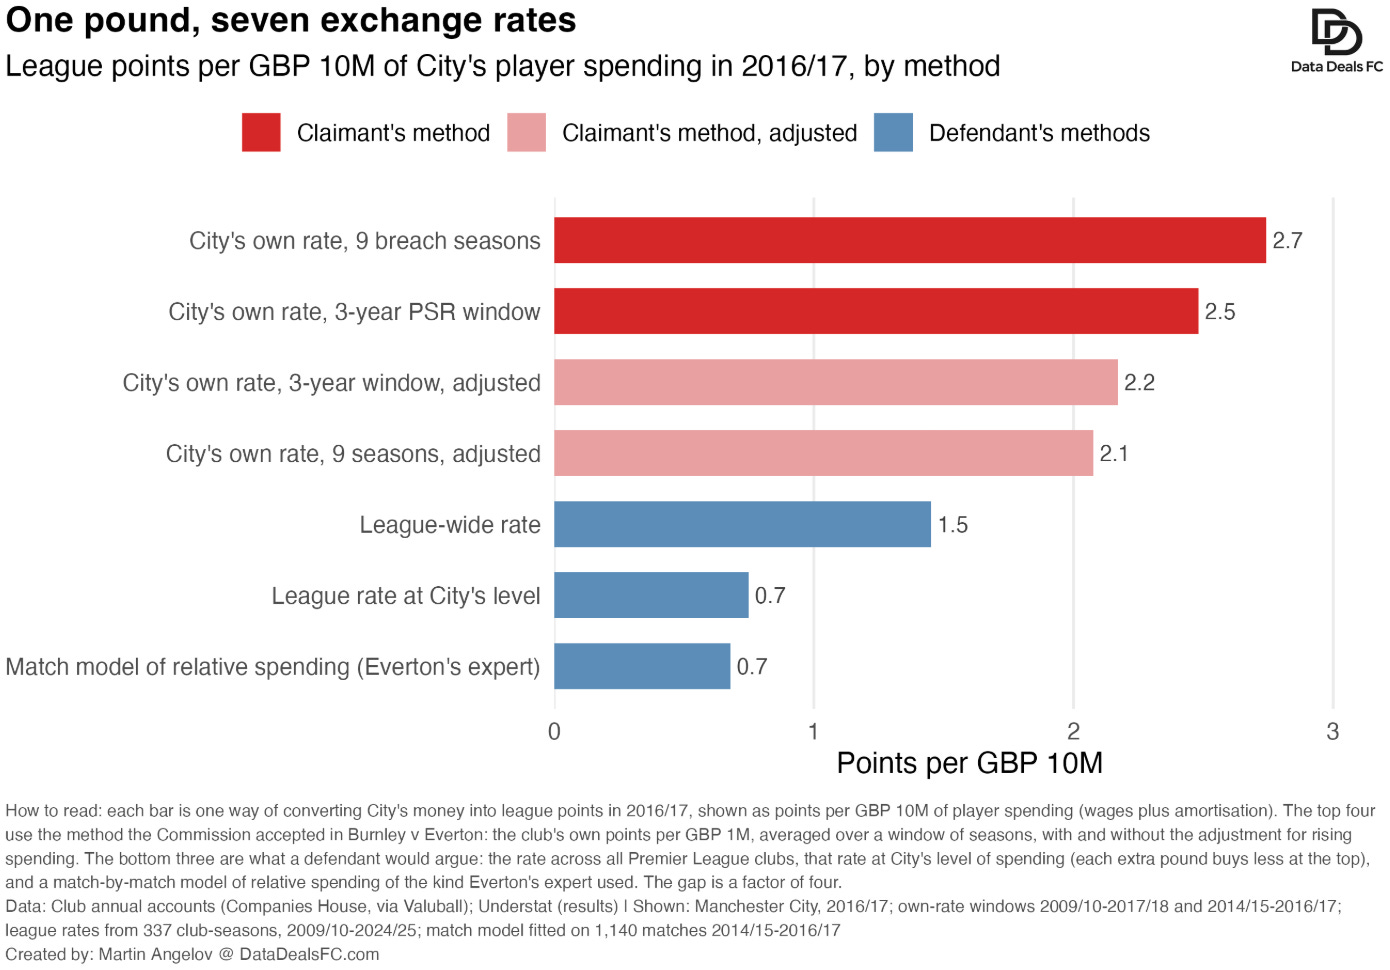
Same club, same season, and the exchange rate differs by a factor of four depending on who is doing the sum.
In Burnley v Everton this question did not need a clean answer, because Everton was a mid-table spender. The Commission accepted that diminishing returns exist in general and said they bite at clubs spending much more than Everton. City is the club that discussion was about. So this is one of the points where the precedent helps City more than Arsenal.
Step 4: Turn The Points Into a Top-Four Place
This is where I expected to copy and paste the Burnley method. It turned out to be the most interesting part of the whole exercise, because the method does not survive the move.
Here is what Burnley’s experts did, in one sentence:
weaken Everton,
replay Everton’s 38 matches 100,000 times,
leave every other match as it happened, and
count how often each club is relegated.
I did the same for City in 2016/17. I built ratings for all twenty clubs from the betting market’s closing odds, as in Part 2, weakened City, replayed City’s 38 matches 100,000 times and counted how often Arsenal finish in the top four.
Then I ran it with nothing taken off City at all, as a check.
Arsenal made the top four in 81% of those seasons.
That cannot be right as a description of what happened. With nothing removed, we know what happened: Arsenal finished fifth.
So where does the 81% come from?
Why the Burnley test breaks
Replaying City’s matches does not only reshuffle City’s points. It reshuffles the points of everyone City played.
In the real 2016/17, Liverpool took four points from their two matches against City: a 1-0 win and a 1-1 draw. Arsenal took one: a 2-1 defeat and a 2-2 draw. That three-point swing is the entire gap between fourth and fifth. Replay those four matches and, on average, the two clubs do about equally well against City, and Arsenal’s actual lead over Liverpool in all the other matches puts them fourth most of the time.
In other words, the replay hands Arsenal better luck against City, and calls it a result.
Burnley’s case had the same feature, but it did not matter much there. It was two clubs fighting over one place, and the experts compared the two directly: who goes down more often, Everton or Burnley?
Here there are three clubs, City, Liverpool and Arsenal, fighting over two places. “Does Arsenal make the top four?” can come out yes without City’s breach having anything to do with it.
City’s economists would spot this in the first hour. So I built two stricter tests.
Three tests
Test A: replay City’s season, and ask whether Arsenal make the top four. The Burnley method as it stands. It says 81% before a pound is removed, so it cannot tell the breach from the dice. I would not rely on it, and I do not think a tribunal would.
Test B: replay City’s season, and ask whether Arsenal finish above City. This is the head-to-head question, the nearest thing to “Everton or Burnley?”. With nothing removed, Arsenal finish above City in 41% of replays. It passes 50% once City are 1.7 points weaker.
Test C: same luck. This one keeps the season as it actually happened and changes only City’s strength. Think of each City match as having had its own roll of the dice. City beat Arsenal 2-1 in December 2016. A slightly weaker City, with the same roll, might still have won. A much weaker City, with the same roll, would have drawn or lost. In this test a weaker City can only do the same or worse in each match than it really did; and when City drop points, their opponents that day pick them up. With nothing removed, this test gives back the real league table exactly: Arsenal fifth, 0%. That is the property the Burnley method lacks. And it passes 50% once City are 3.3 points weaker.
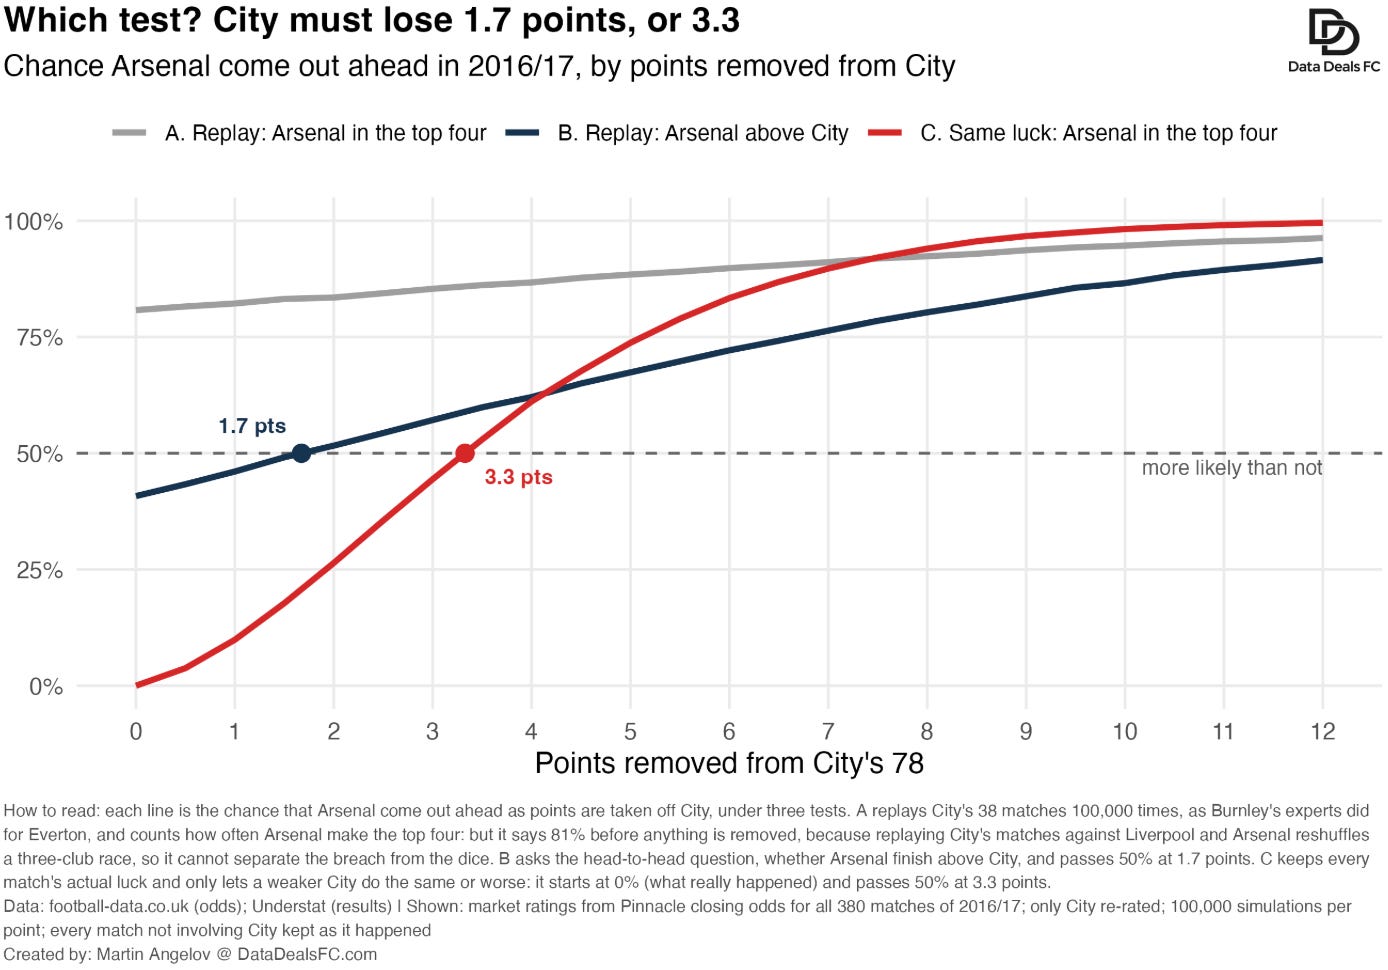
Why 3.3 and not exactly three, the gap in the table? Because City also had the better goal difference, so City needed to fall four points behind their real total, or Arsenal needed to gain from their own matches against a weaker City. Sometimes three and a half points of weakness produces that, sometimes it does not. At 3.3, it happens just over half the time.
What Arsenal would argue: test B. It is the comparison the Commission itself relied on.
What City would argue: test C, or something stricter still.
I think test C is the more defensible of the two, because it is the only one that starts from what actually happened. So from here on I hold Arsenal to it.
How much money is that?
Now we can join steps 3 and 4. How much money has to come off City for City to lose 3.3 points?
With City’s own rate, the method the Commission accepted: £12M to £16M.
With the league-wide rate: £23M.
With City’s best rates, the league rate at the top or the match model: £44M to £50M.
Notice what this does. It turns the argument around. We no longer need to know exactly how much money is in play. We only need to know whether it is more than about £50M. If it is, Arsenal pass the strictest test under every exchange rate, including the ones most favourable to City.
Who wins?
Put the five ways of counting the money from step 1 against the seven exchange rates from step 3. That is 35 combinations. To be cautious I use the lower of my two assumptions about the money, the even spread.
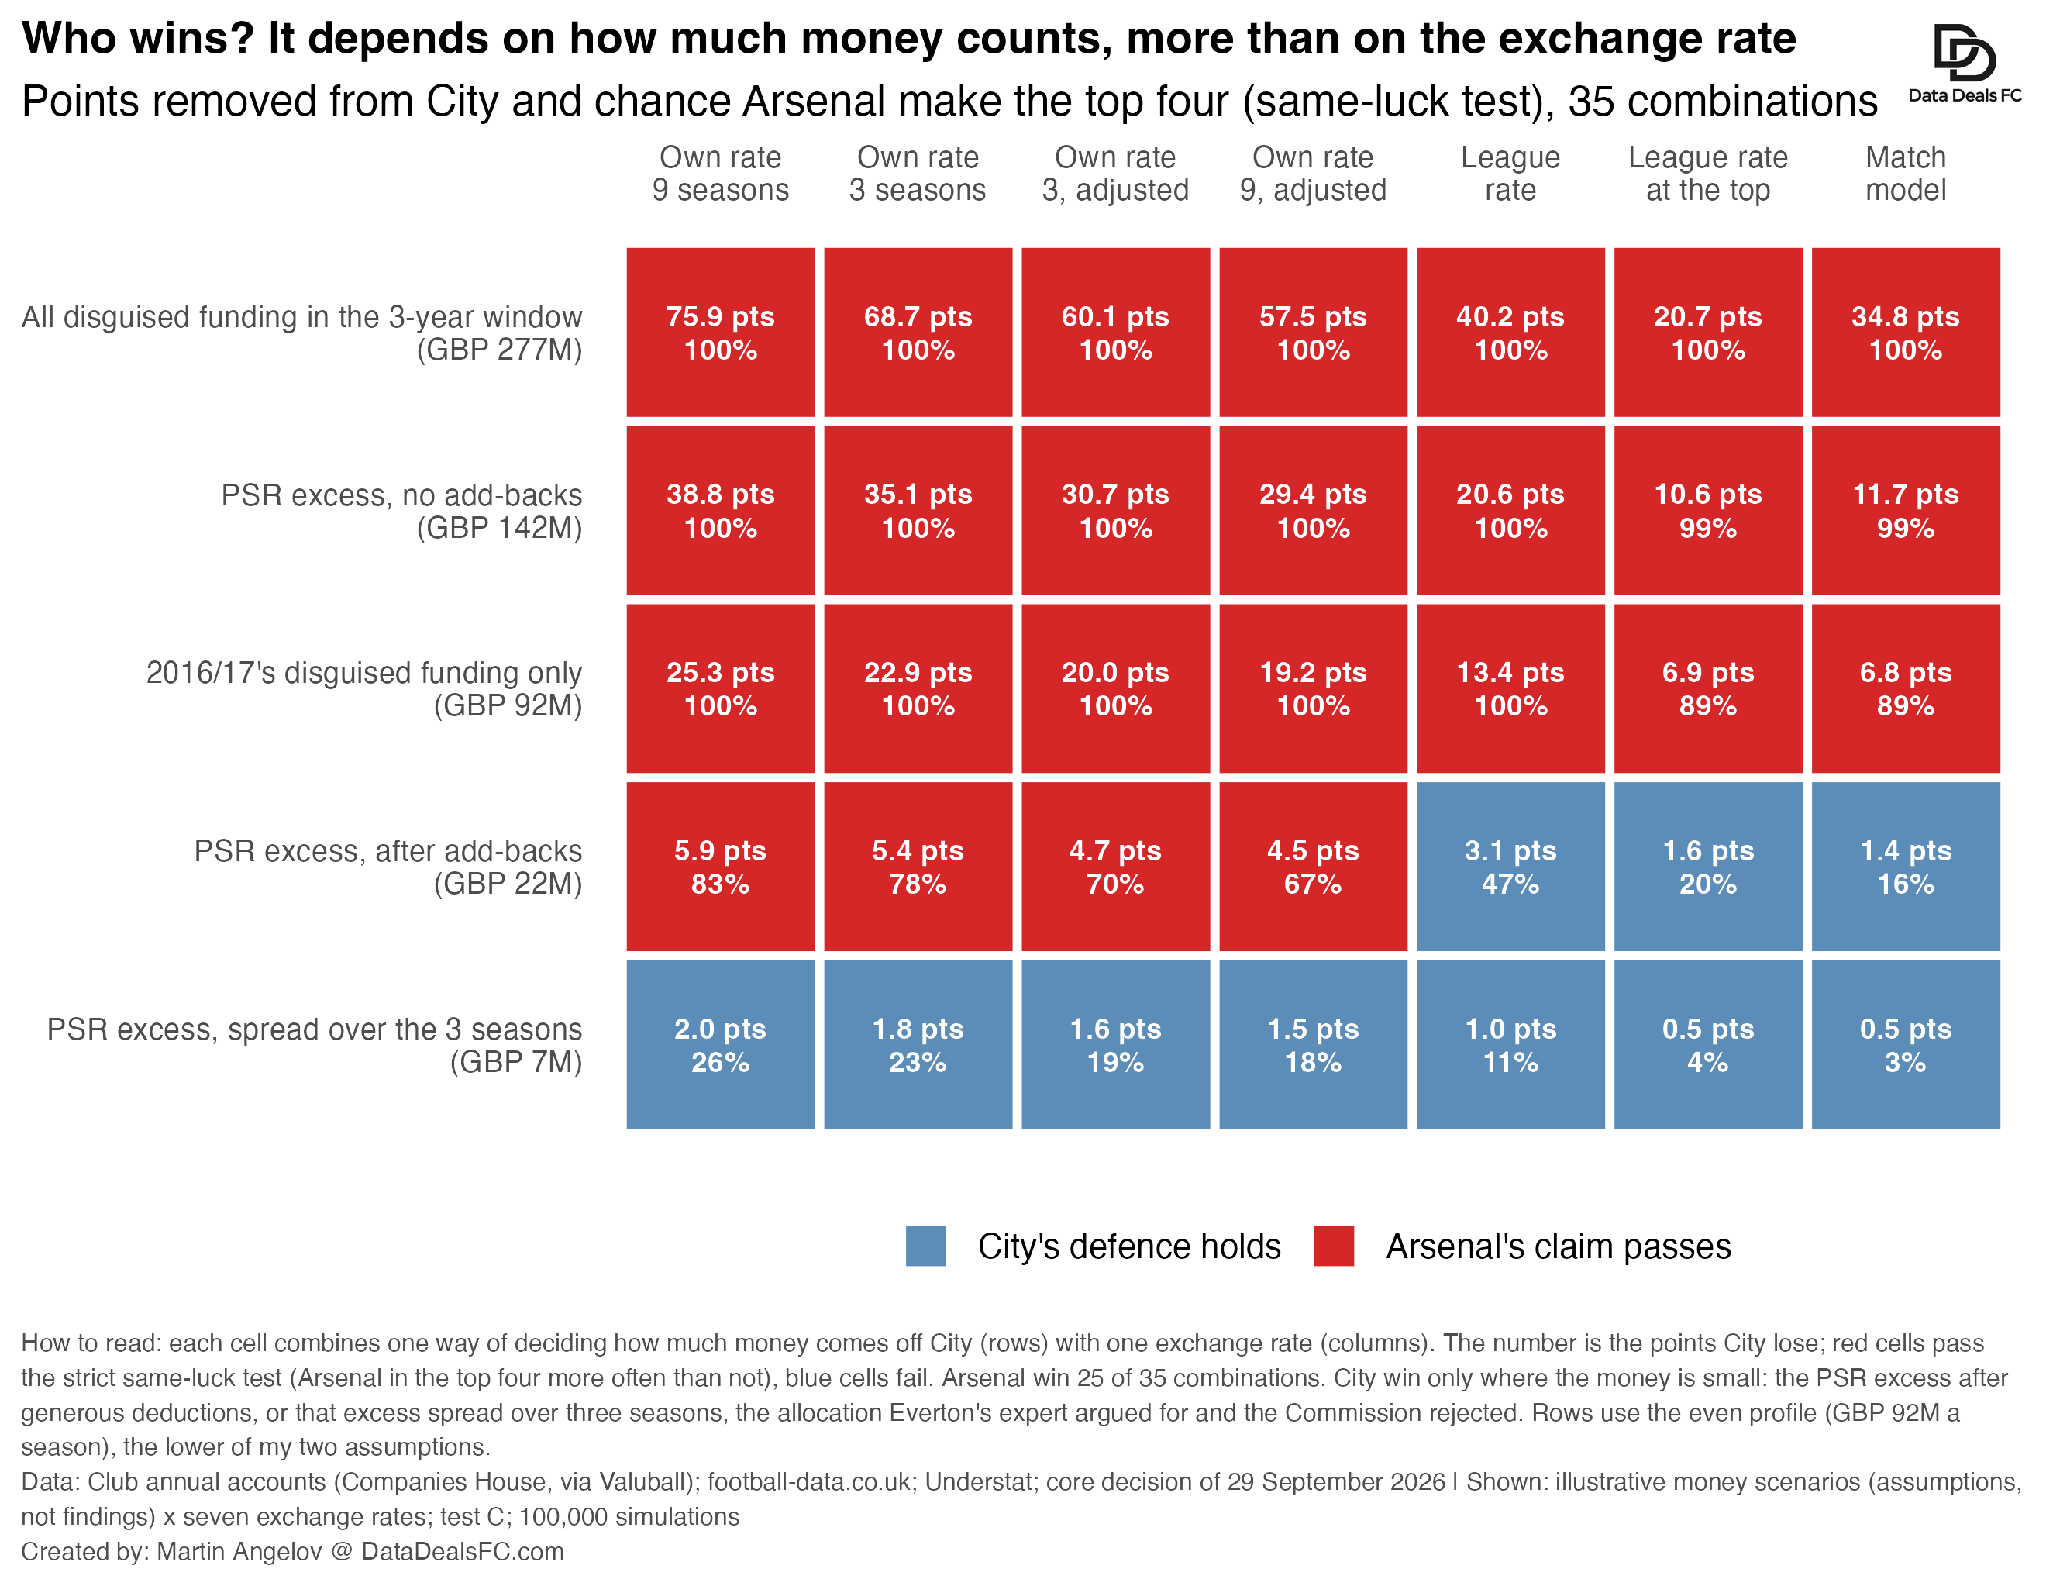
Arsenal’s claim passes in 25 of the 35.
Look at where City win. The whole bottom row: the excess over the limit, spread across three seasons, £7M on these assumptions. And the right-hand end of the row above it: the excess after deductions, £22M, combined with City’s preferred exchange rates.
The top three rows are red all the way across. Once the money counted against 2016/17 is £92M or more, the exchange rate stops mattering.
So this is what I take from the simulation. The fight over the exchange rate, which looked decisive in Part 2, is the second most important fight. The first is how much money is attributed to the season. City need to win that argument; winning the exchange rate alone is not enough.
One more thing a careful reader will ask. In Burnley’s case the margin was wafer-thin, 50.5% against 47.6%, and Burnley still recovered its whole loss. The same would apply here: if a tribunal accepts causation on the balance of probabilities, Arsenal recover the full loss, not a percentage of it. City would argue for a percentage, the “loss of a chance”. The Burnley decision did not go that way, though it also never discussed the alternative.
Step 5: Price The Season
Suppose Arsenal clear causation. What did fifth place cost?
The cleanest evidence is in Arsenal’s own accounts. 2016/17 was a Champions League season; 2017/18 was a Europa League season. Both fell under the same Premier League TV deal.
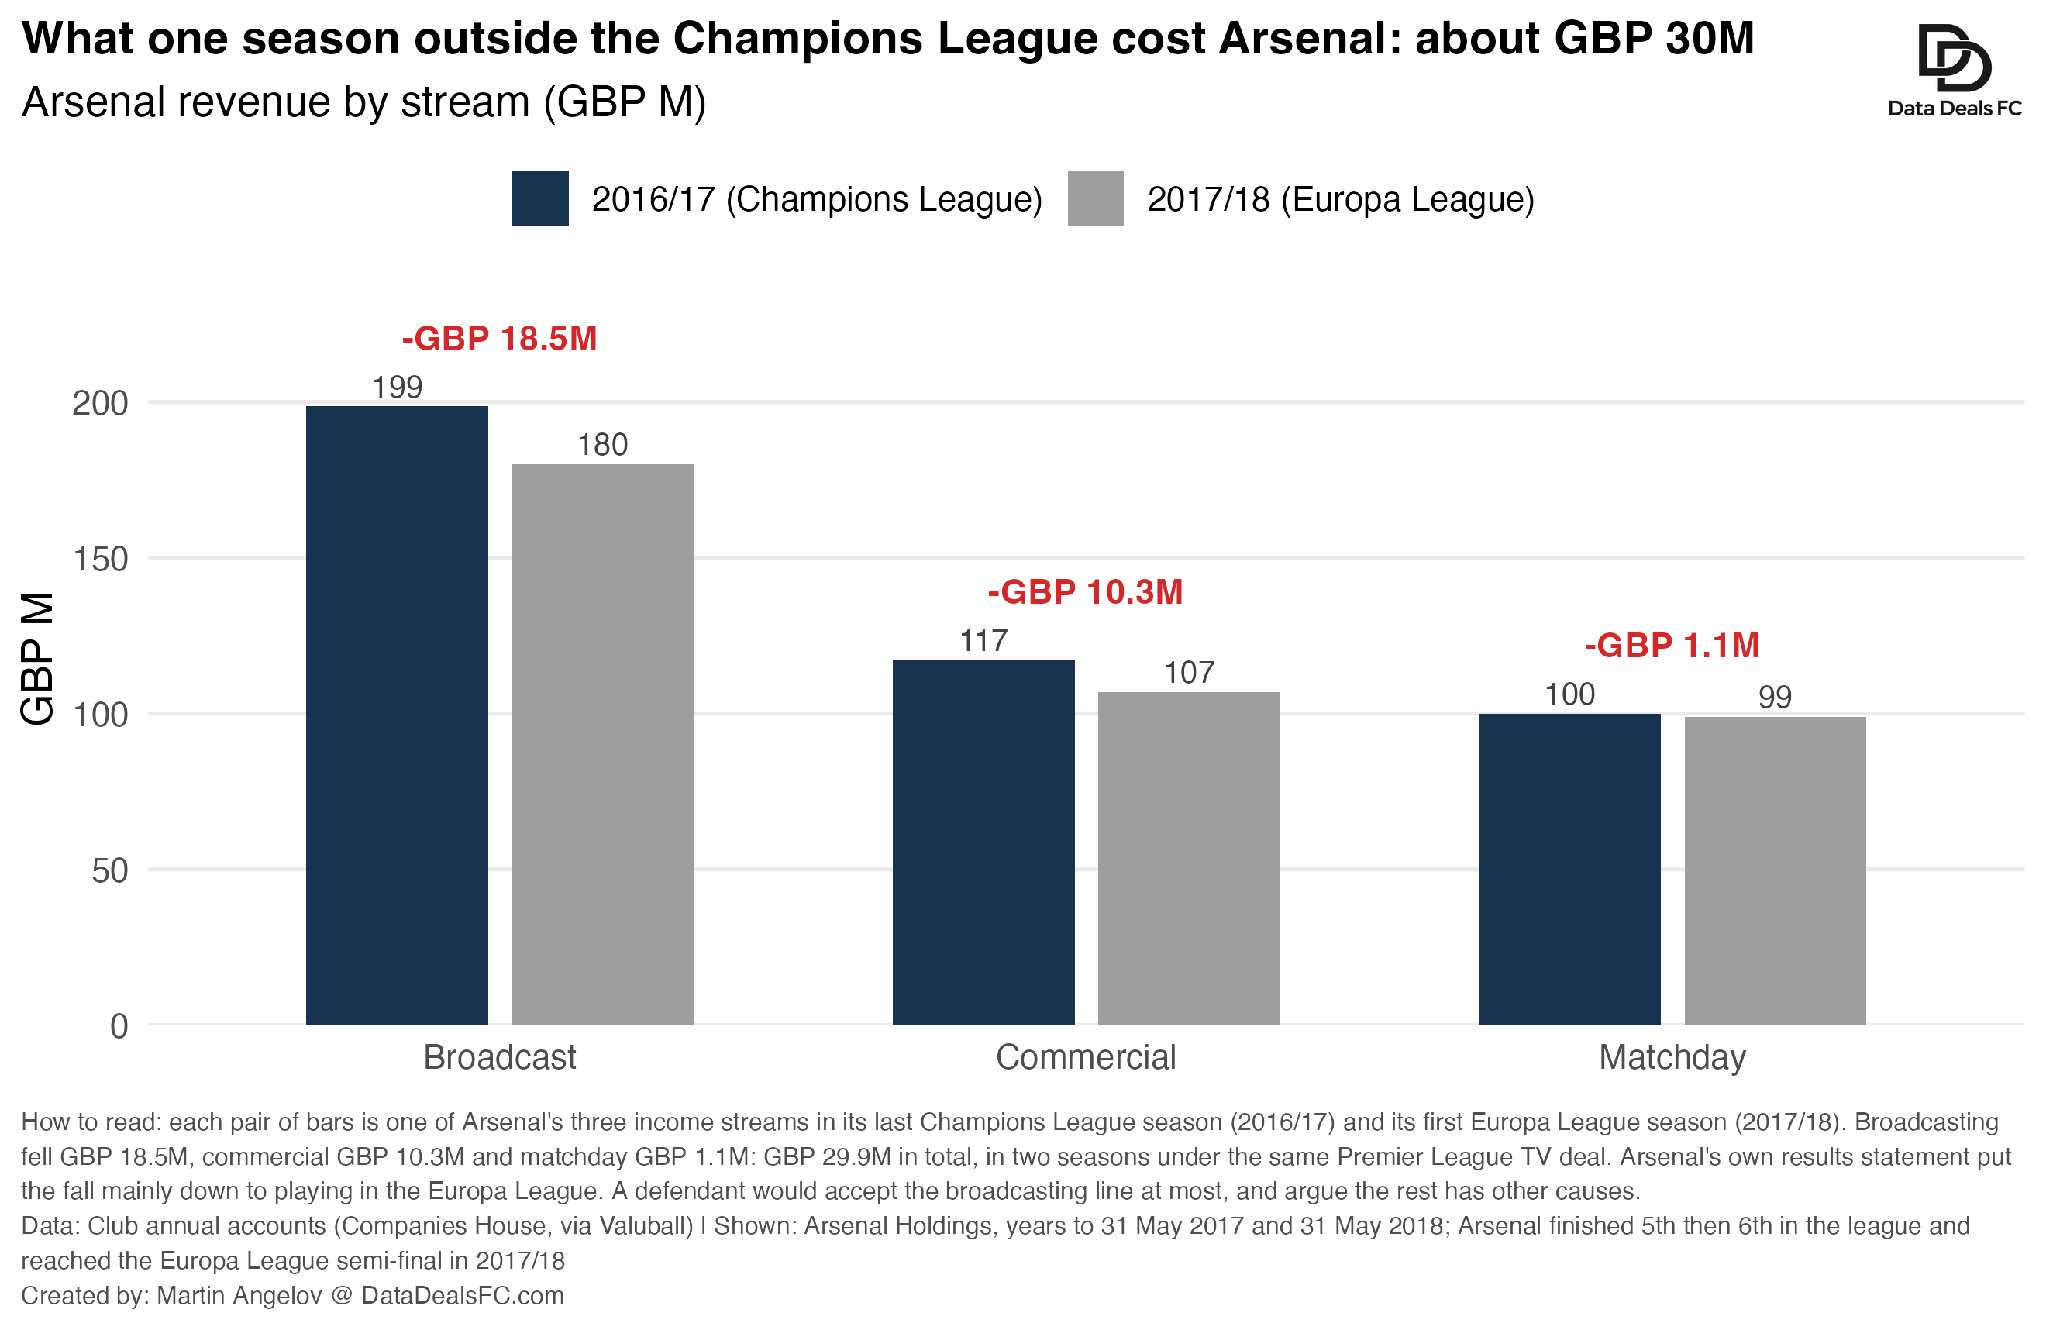
Revenue fell by £29.9M: £18.5M in broadcasting, £10.3M in commercial income and £1.1M on matchdays. Arsenal’s own results statement that year put the fall mainly down to playing in the Europa League rather than the Champions League.
That is the starting point. From there, each side would pull in the direction you would expect, and we know from Part 2 how wide that gap can get. Burnley’s accountant said £51.7M. Everton’s said Burnley had made a profit.
What Arsenal would argue
The full £29.9M. Plus the prize money for finishing fourth instead of fifth, about £1.9M. Plus the knock-on: Arsenal did not return to the Champions League until 2023/24, and Champions League money buys players who help you qualify again. Burnley’s accountant handled that kind of uncertainty by building four paths and weighting them equally, and the Commission accepted it. The equivalent here is the Champions League lost for one, two, three or four seasons, 25% each.
What City would argue
Only broadcasting can be tied to the Champions League; commercial income moves for many reasons. Missing the Champions League also saves money, because players’ contracts carry bonuses for it. And one season only: in 2017/18 Arsenal finished sixth, twelve points off fourth, and that was nobody’s fault but their own.
I think City would win the argument about knock-on seasons. The Commission cut Burnley’s most optimistic assumption (finishing 13th every year became 15th), and refused to look beyond the years for which real figures existed. A tribunal is unlikely to hand Arsenal four seasons of Champions League money on the strength of one missed place.
Step 6: Add Interest
The Commission used Burnley’s own average cost of borrowing, compounded annually: 7.6% rising to 11.8%.
Arsenal borrow far more cheaply. From the accounts, interest paid as a share of borrowings was about 6.5% in 2017/18, fell to 2% to 3% after the stadium bonds were replaced by a loan from the owner in 2020, and has been around 5% since.
Compounded from May 2018 to today, that multiplies the loss by 1.43. So interest adds 43%, against 35% for Burnley over four years at much higher rates. Eight years of waiting does that.
The claim, assembled
Four versions.
Arsenal’s ask: about £98M. The full revenue gap, four equally weighted paths, plus interest.
A Commission-style middle: about £37M. One season, with 80% of the lost revenue reaching profit (the 80% is my placeholder for saved bonuses and costs; I have no data on Arsenal’s contracts), plus the prize money, plus interest.
City’s fallback: about £21M. One season, broadcasting only.
City’s main case: nothing. No causation, no loss.
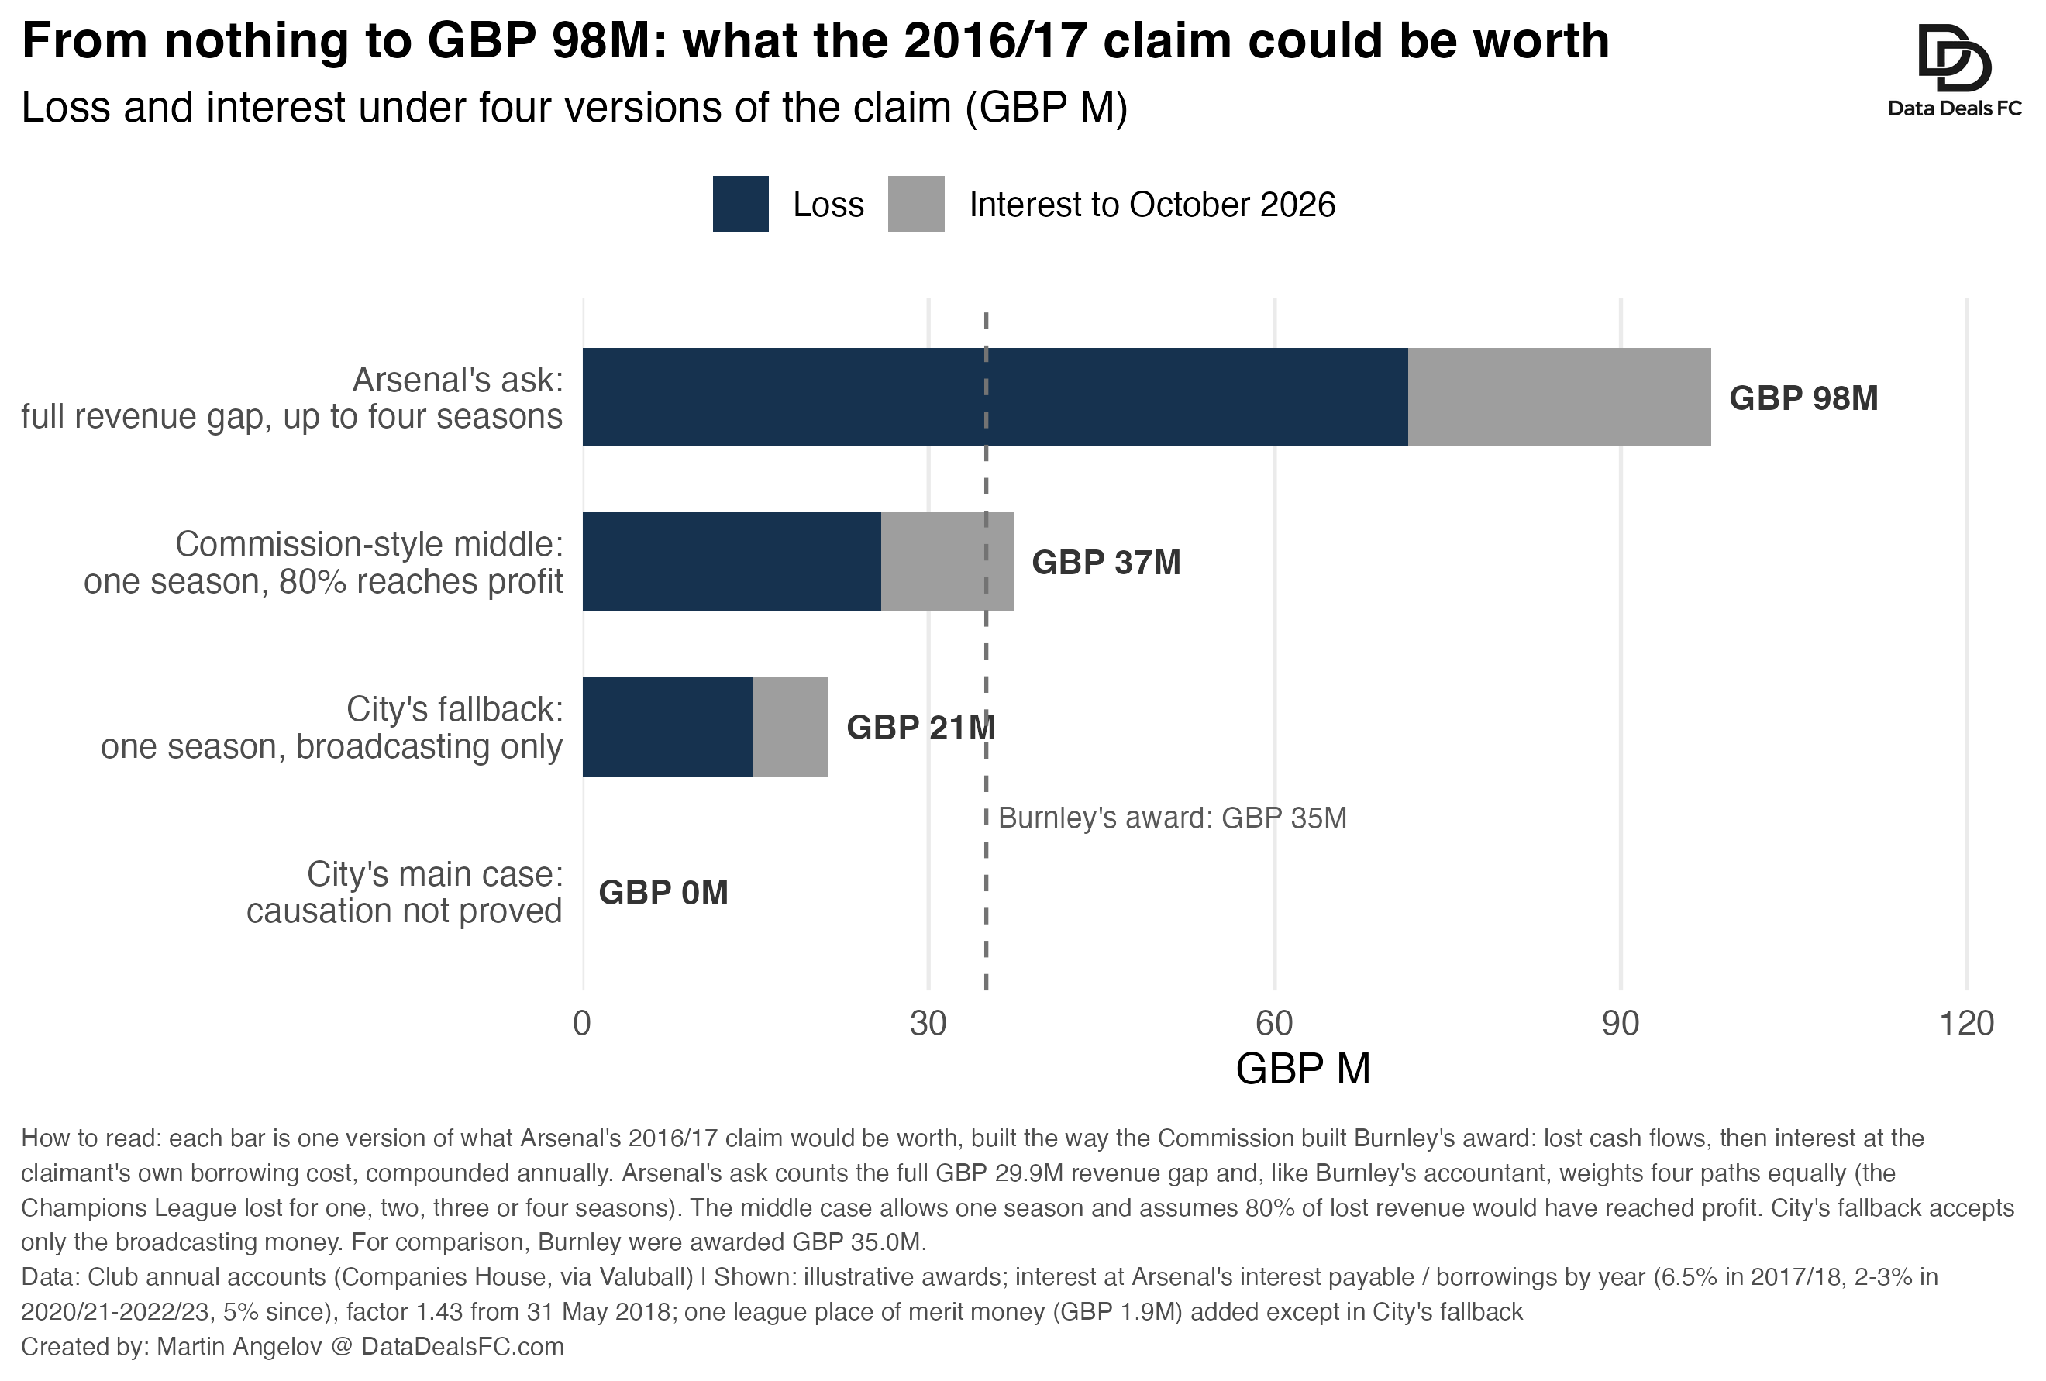
If I had to pick the most likely landing zone, should the claim succeed, it is the middle one. And £37M is almost exactly what Burnley were awarded. That is a coincidence, but it is a useful one: it tells you the scale. A single missed Champions League place is worth about the same as a relegation was to Burnley.
It also tells you something about the bigger picture. The Commission found more than £830M of overstated income. The best single claim Arsenal can build from it is worth a few tens of millions. For City, the danger was never one claim. It is ten clubs each bringing two or three.
Where City would fight
Put the whole thing together and City’s defence has four lines, in the order I think they matter.
The amount. Only the excess over the spending limit counts, after every deduction, spread across the assessment period. On my assumptions this is the only argument that wins the case on its own.
The test. The Burnley simulation gives Arsenal 81% with no breach at all, so it proves nothing; apply a strict test. This costs Arsenal some ground, 3.3 points needed instead of 1.7, but does not defeat the claim unless the amount is small.
The exchange rate. Each extra pound buys less at the top. This cuts the points by a factor of up to four. Again, it only decides the case if the amount is small.
The damages. One season, broadcasting only, no knock-on. This is where City is most likely to win something.
And two that sit outside the economics. Whether a claim about May 2017 is still in time, which turns on when the clock started and on the Commission’s findings of concealment. And whether any of this survives City’s appeal.
The part worth keeping
I started this expecting the exchange rate to decide everything, because it decided so much of the argument between Burnley and Everton.
It does not. What decides Arsenal’s claim is a number in an unpublished appendix: how much of City’s disguised funding counts against 2016/17. If it is above roughly £50M, Arsenal clear the strictest test I could build, under every exchange rate City could argue for. If it is nearer £20M, City have a real defence.
The other thing I will keep is the 81%. A method that a tribunal accepted in one case gave a nonsense answer when I moved it to the next one, for a reason that has nothing to do with football finance: two clubs for one place became three clubs for two. Precedents carry reasoning, not software. Anyone running the Burnley playbook for another club will have to check that it still measures what they think it measures.
Boom — that was the damages claim Arsenal could bring against City.
Thank you for reading until the end ❤️
In Part 4, Liverpool: three titles lost to City by two points or fewer, only one of them inside the period of the Commission's financial findings. That is a very different claim, and in two of the three cases a harder one.
See you next week,
Martin
PS. If you enjoyed this piece, you might also enjoy how Kevin De Bruyne used data scientists to negotiate his City contract and how City used a data science technique to find De Bruyne’s replacement.
P.P.S. If a tailor-made report (such as the one I did on Kai Havertz’s contract negotiation) is what interests you, drop me a line @ martin.angelov@datadealsfc.com
Method note
Money scenarios. The core decision gives a total (income overstated by more than £830M, 2009/10 to 2017/18) but not the split by season. I used two assumed profiles: even (£92.2M a season) and proportional to City’s reported commercial revenue (scaled to twelve months where the accounting year was longer (£125M in 2016/17)). The PSR excess for 2016/17 is the reported profit before tax for 2014/15 to 2016/17 (£30.1M), less the overstated income in those seasons, less the £105M limit, with and without an assumed £40M a year of allowable deductions. None of these is a finding.
Exchange rates. Own rate: mean of City’s yearly points per £1M of wages plus amortisation, over 2009/10 to 2017/18 and over 2014/15 to 2016/17; adjusted versions restate each season’s spending in 2016/17 money using total Premier League spending. League rates: from 337 club-seasons, 2009/10 to 2024/25, linear and logarithmic in spending relative to the league average. Match model: ordered logit of match result on the log ratio of home to away spending, 1,140 matches, 2014/15 to 2016/17.
Simulation. Ratings from Pinnacle closing odds (result) and market-average over/under 2.5 odds for all 380 matches of 2016/17, margin removed in proportion to the odds, as in Part 2. Tests A and B: City re-rated so that its expected points fall by the stated amount; City’s 38 matches replayed 100,000 times; all other results as they happened. Test C: each City match keeps a random draw consistent with its actual result under the original probabilities; the same draw is then read against the weaker City’s probabilities, so results can only stay the same or get worse for City; goal difference moves by one goal per step.
Damages and interest. Revenue from Arsenal’s accounts for the years to 31 May 2017 and 31 May 2018. Interest rate each year = interest payable divided by borrowings, compounded annually from 31 May 2018 to 1 October 2026.
Sources: Premier League v Manchester City, redacted core decision, 29 September 2026. Burnley v Everton, PLJP 2023/3, decision of 2 June 2026. Manchester City, Arsenal and Premier League clubs’ annual accounts (Companies House, via Valuball). Closing odds for 2016/17 from football-data.co.uk; results from Understat. Arsenal’s financial results statement for 2017/18 (arsenal.com).