


The City Files is a series on the Manchester City verdict and the compensation claims that could follow it.
Part 1: Manchester City’s 115 Charges, Explained in Plain English
Part 2: The £35M Playbook: How Burnley Made Everton Pay, and How City’s Rivals Could Do the Same (you are here)
Part 3: What Arsenal Could Claim
Part 4: What Liverpool Could Claim
Part 5: What Manchester United Could Claim
Hi friends,
In Part 1 of the series, we went through Manchester City’s 115 charges and what the independent commission ultimately found.
Today, I’ll look at what could happen next.
Within hours of the verdict, the BBC reported that several Premier League clubs had sought legal advice on whether they could claim compensation from City.
And this is not starting from scratch. There is already a precedent — and a very recent one.
In June 2026, a Premier League commission ordered Everton to pay Burnley £35M after finding that Everton’s breach of the financial rules had helped keep them in the Premier League in 2022 at Burnley’s expense.
To date, it is the only decided case that shows, in detail,
how a breach of football’s financial rules can be turned into causation, lost points and ultimately a damages figure.
So anyone thinking about bringing a claim against City is going to study it very closely.
That’s what I’m going to do today:
Break down the economics of the case,
Look at the arguments on both sides, and
Reconstruct the Commission’s calculations step by step.
Let’s get into it.
A little bit of context first
On 22 May 2022, the last day of the season, Burnley lost 2-1 at home to Newcastle and were relegated. They finished 18th, 4 points behind Everton, with a better goal difference.
Ten months later the Premier League charged Everton with breaking its Profitability and Sustainability Rules (PSR) in that same season: Everton had lost £19.5M more than the rules allowed. A commission deducted 10 points, cut to six on appeal.
Burnley’s argument was simple to state:
Without the breach, Everton would not have had the squad that kept them up, and Burnley would have survived instead. So Everton should pay for what relegation cost Burnley.
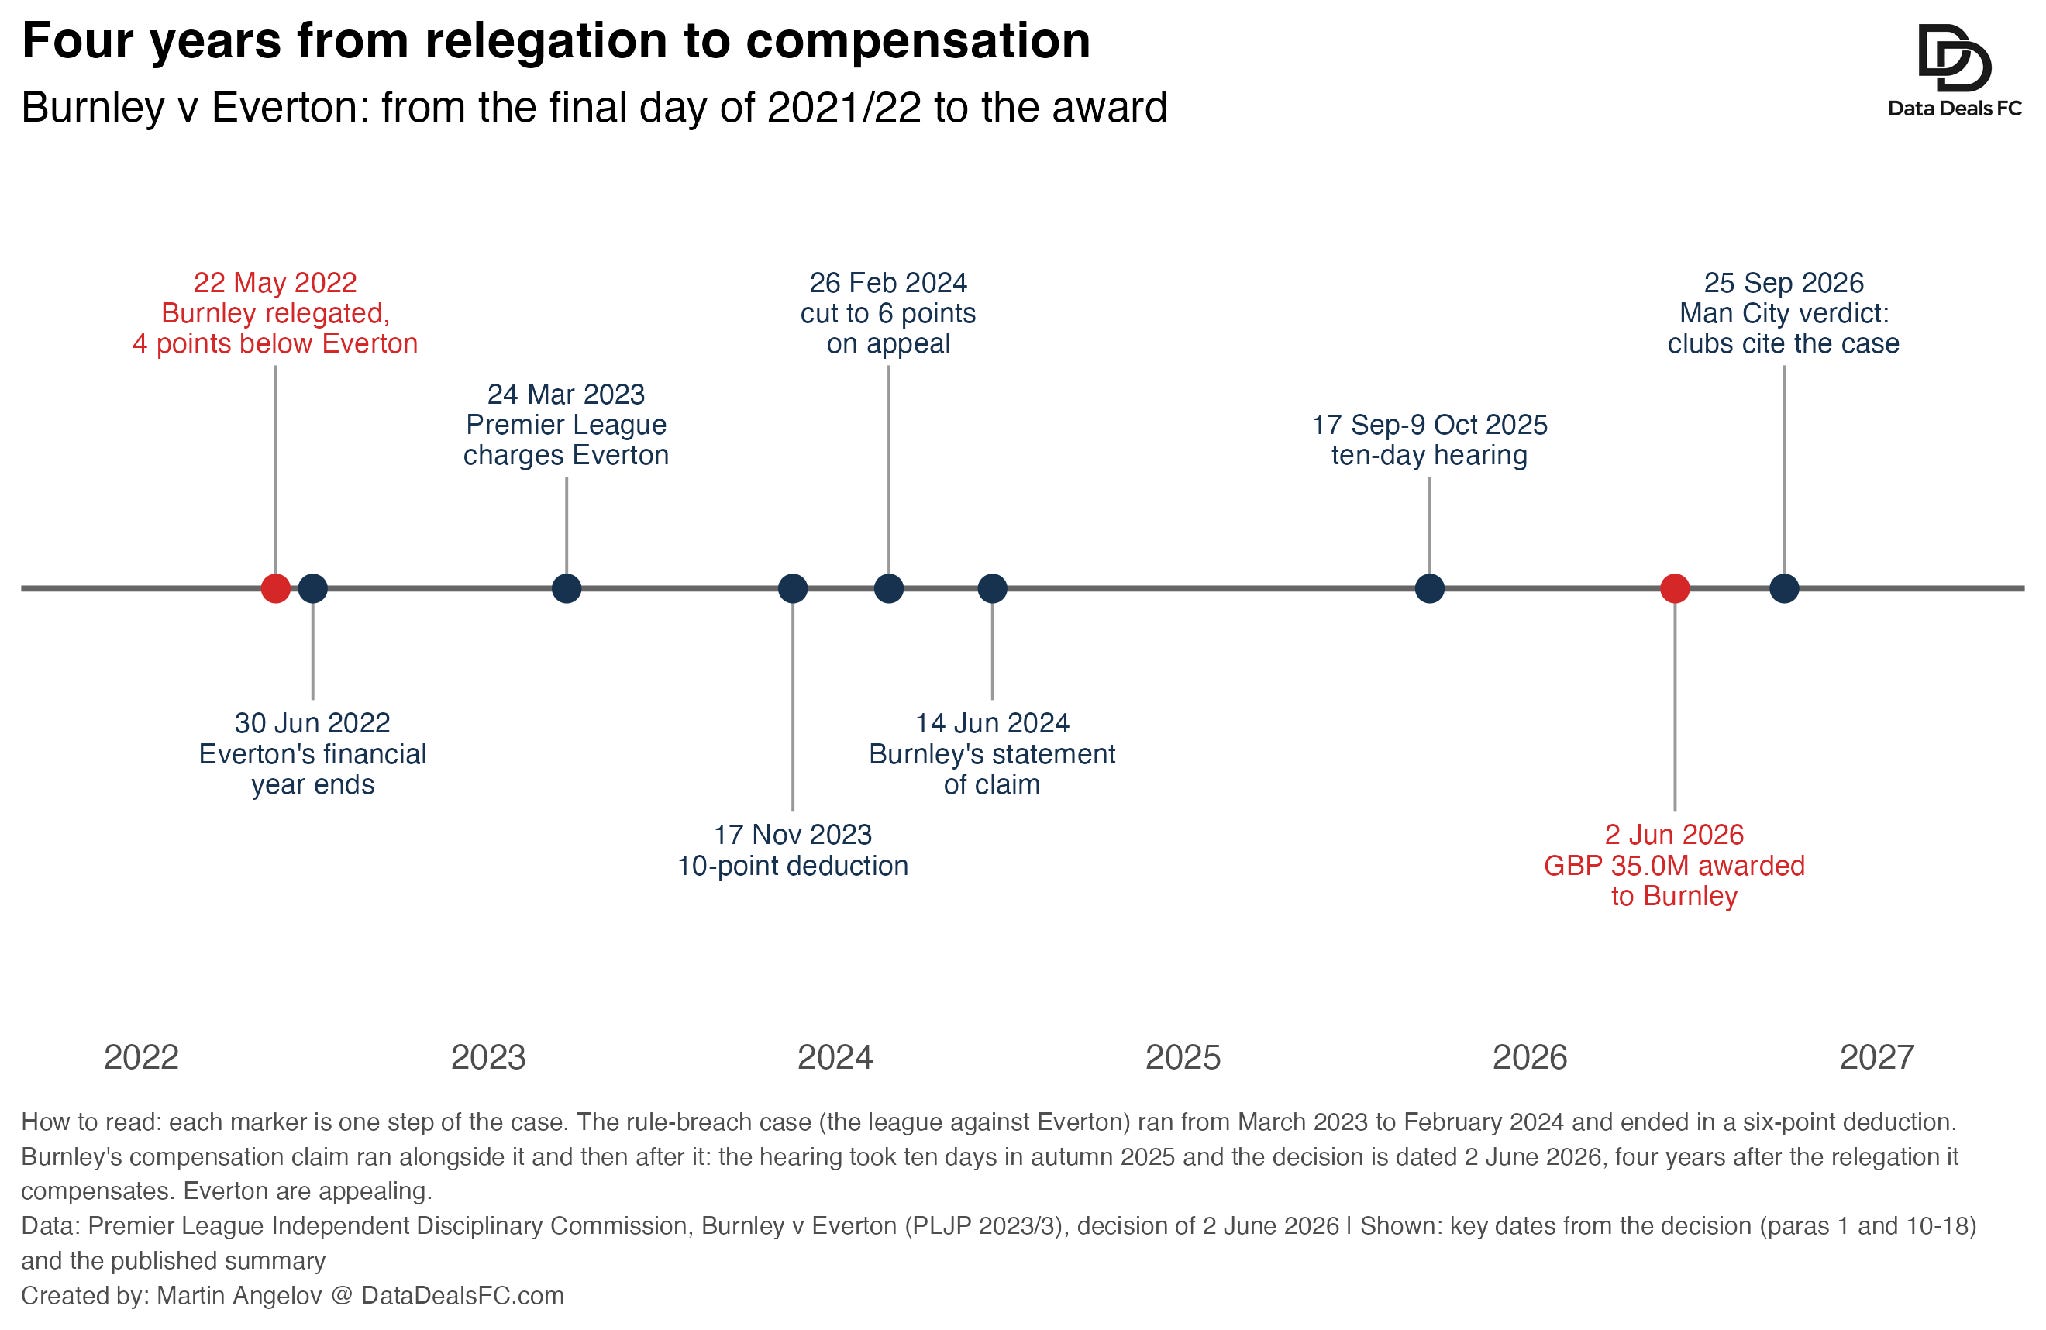
Burnley’s compensation claim was brought under the Premier League’s own disciplinary rules and heard by the same commission that had dealt with Everton’s breach. It was put on hold until the breach case, including Everton’s appeal, was finished. The hearing took ten days in autumn 2025, and the decision is dated 2 June 2026, four years after the relegation it compensates.
Burnley did not have to prove Everton’s breach all over again (!). The league had already established the breach and its size. Burnley’s job was now to show that the breach harmed them — and put a number on that harm.
Other clubs had tried to claim compensation before, but those cases either settled or never produced a full decision. What makes Burnley v Everton different is that a tribunal actually decided the case, explained its reasoning and put a number on the loss.
And that is where the economics starts.
So how do we quantify the damage suffered?
It boils down to 6 steps.
Step 1: Start from the breach that has already been proved
The Commission treated the findings from Everton’s original case — including the £19.5M overspend — as binding in the compensation proceedings.
Burnley therefore did not need to prove the overspend again, and Everton could not argue that it was smaller.
But the principle worked both ways: when Burnley tried to rely on other alleged breaches that had never been established, the Commission refused. Compensation could only be based on breaches actually found.
That matters for City’s rivals too. Their starting point would be whatever breaches and amounts ultimately survive City’s own proceedings.
But knowing that a breach happened is not enough.
One needs to ask next, what would have happened if it had not?
Step 2: Build the “what if” world
Economists call this the counterfactual: the world in which Everton complied with the rules.
Everything that follows depends on it, because
Damages are essentially the difference between that world and what actually happened.
Everton argued for the least disruptive version. Without the breach, it said, it could simply have sold another player before the 30 June 2022 year-end, or avoided some earlier signings and sold players who were underperforming anyway.
The Commission rejected both. Its test was practical: what would a club acting in good faith, and in its own commercial interests, realistically have done?
Its answer was that Everton would have needed to raise another £19.5M from player sales earlier in the 2021/22 season.
In plain English:
Without the breach, Everton would probably have had a weaker squad.
That gets us halfway there. We now have:
Everton overspent by £19.5M.
Without that overspend, its squad would likely have been weaker.
And this begs the logical question of how much weaker points-wise would Everton have been? Or in other words,
How many points was that £19.5M worth?
Step 3: Turn the money into points
This is where the economic experts on both sides started disagreeing.
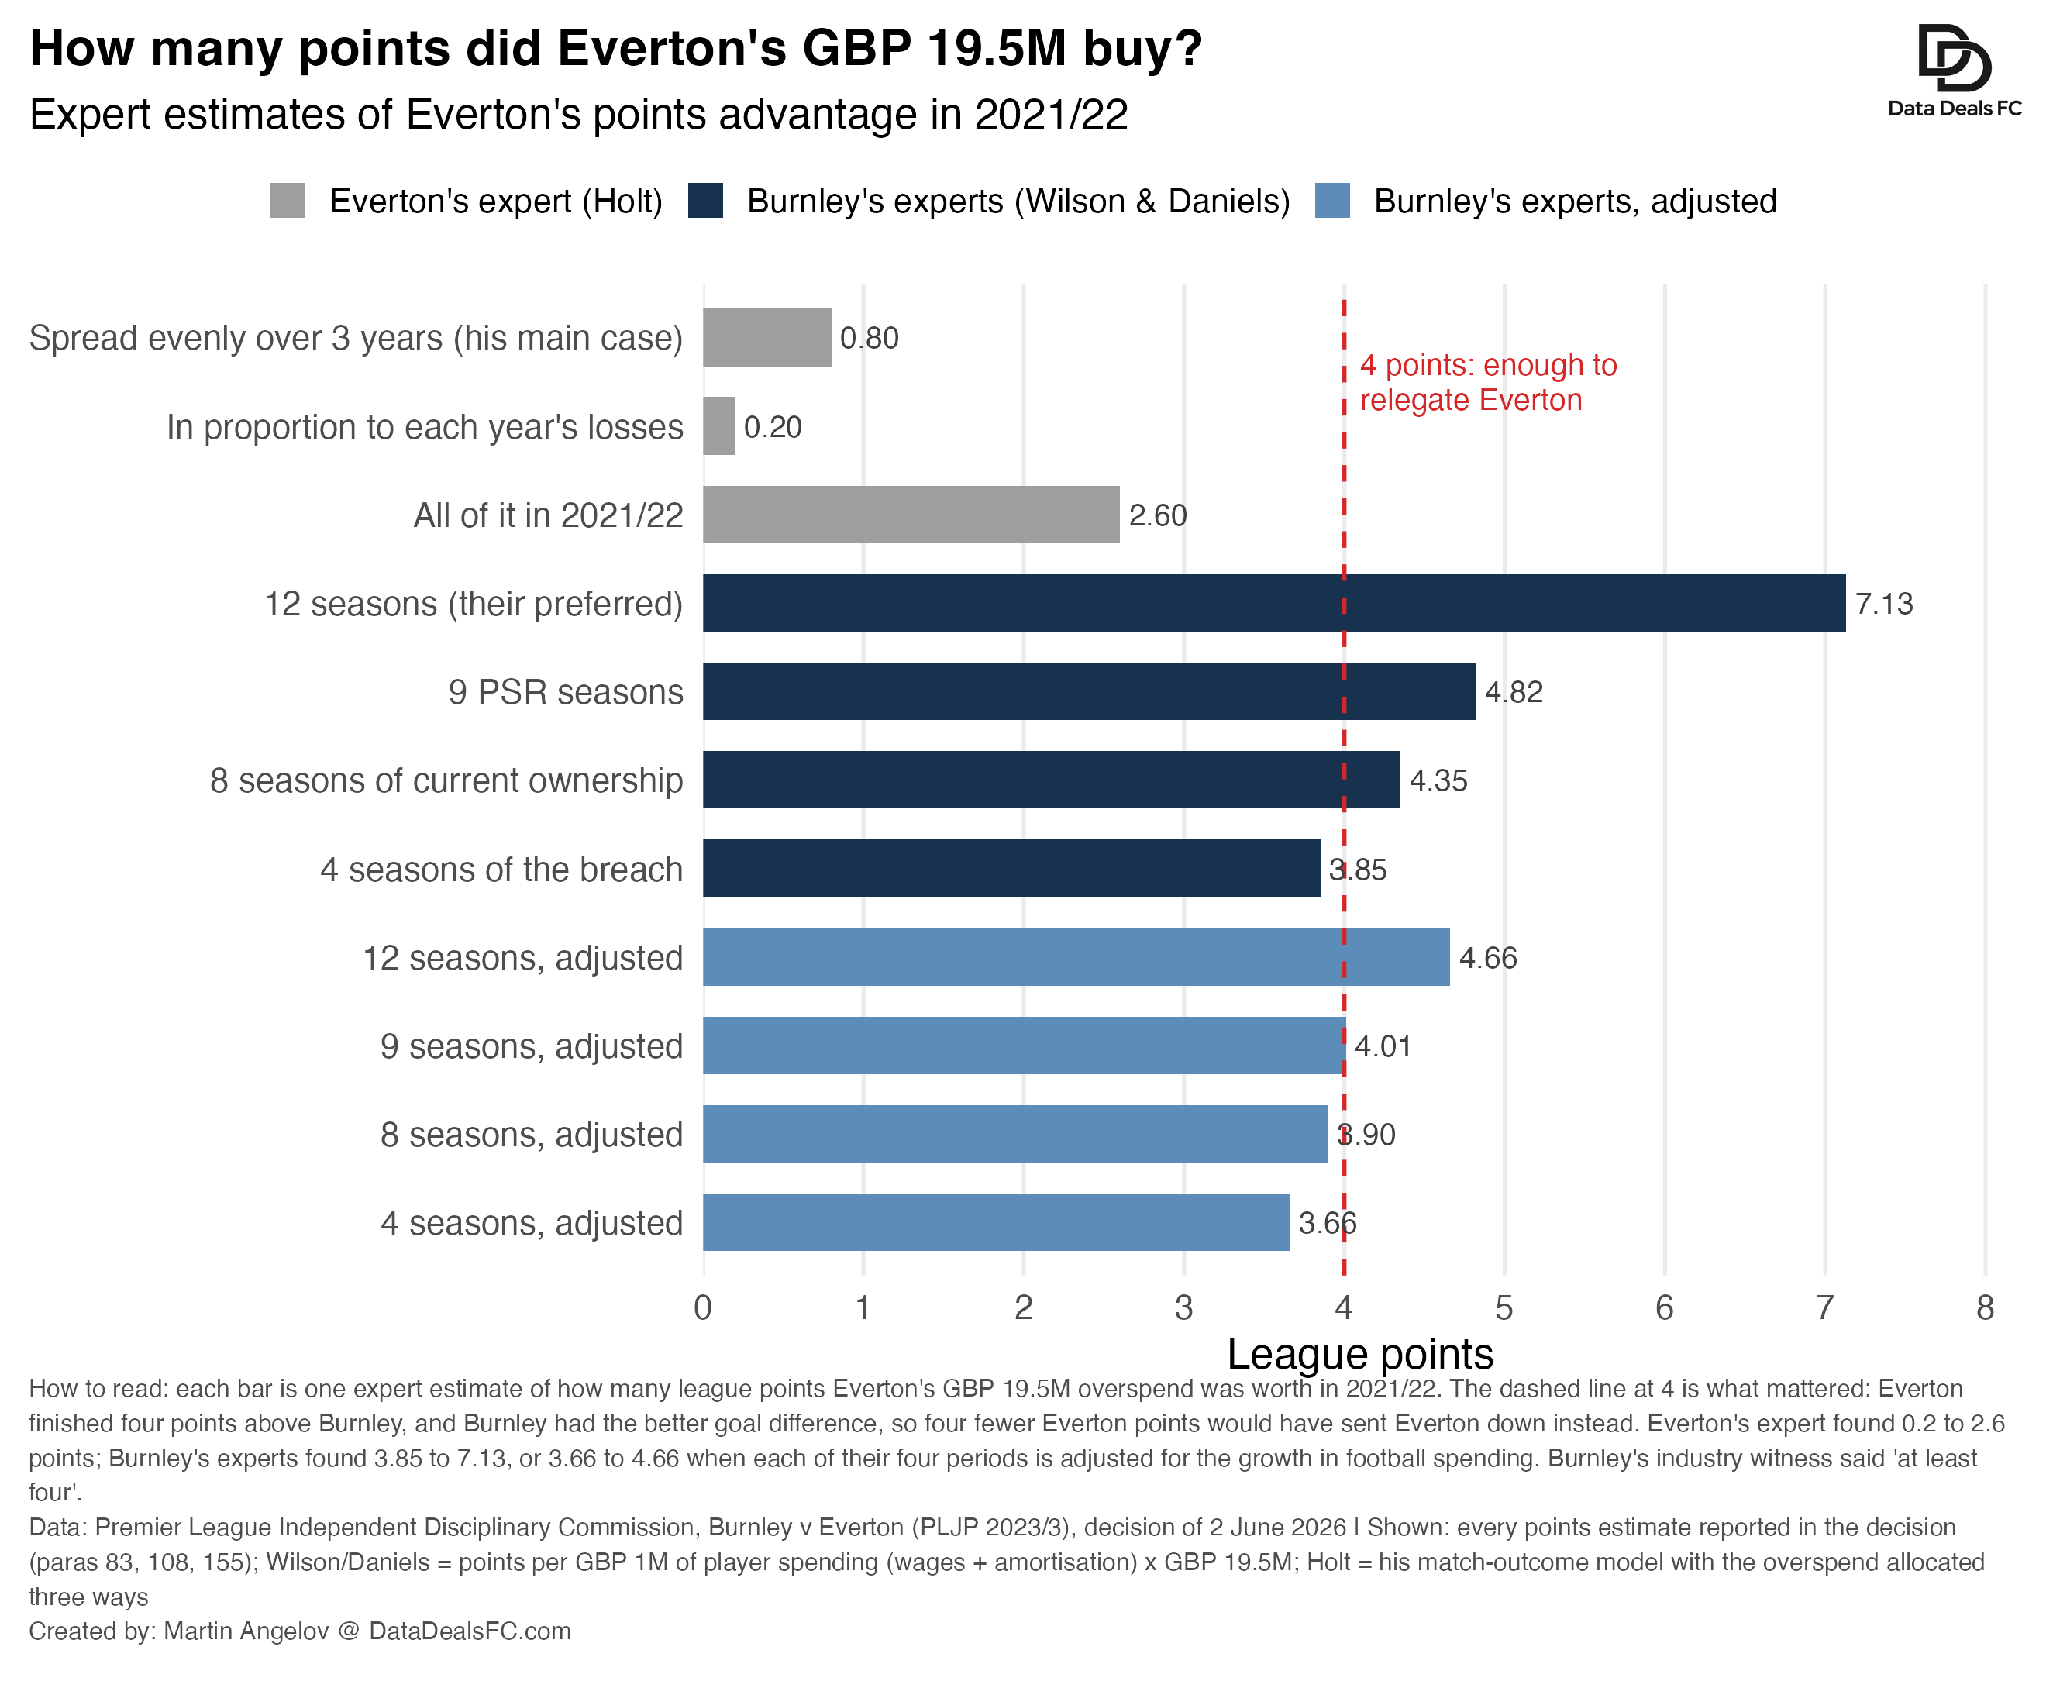
Burnley’s experts estimated that Everton’s overspend had been worth roughly 3.7 to 7.1 points.
Everton’s expert got as little as 0.2 to 2.6.
Same £19.5M. Completely different answers.
Why?
Because there is no observable exchange rate between pounds and Premier League points.
The experts had to build one. And they built it quite differently.
What Burnley’s experts did
Burnley’s experts started with player spending: wages plus transfer-fee amortisation. A £50M player on a five-year contract, for example, contributes £10M a year in amortisation, on top of his wages.
First, they checked the basic premise: do clubs that spend more actually win more points?
Across twelve Premier League seasons, the answer was clearly yes. The reported correlation between player spending and points was 0.72 (I rebuilt the same calculation from clubs’ published accounts and got 0.68 - not identical, but telling the same story).
Then came the important part.
They calculated Everton’s own points per £1M of player spending and averaged that rate over four different periods (see figure below). Depending on the window, multiplying that rate by the £19.5M overspend produced 3.85, 4.35, 4.82 or 7.13 points.
Everton’s published accounts contain everything needed to reproduce those numbers, so I did.
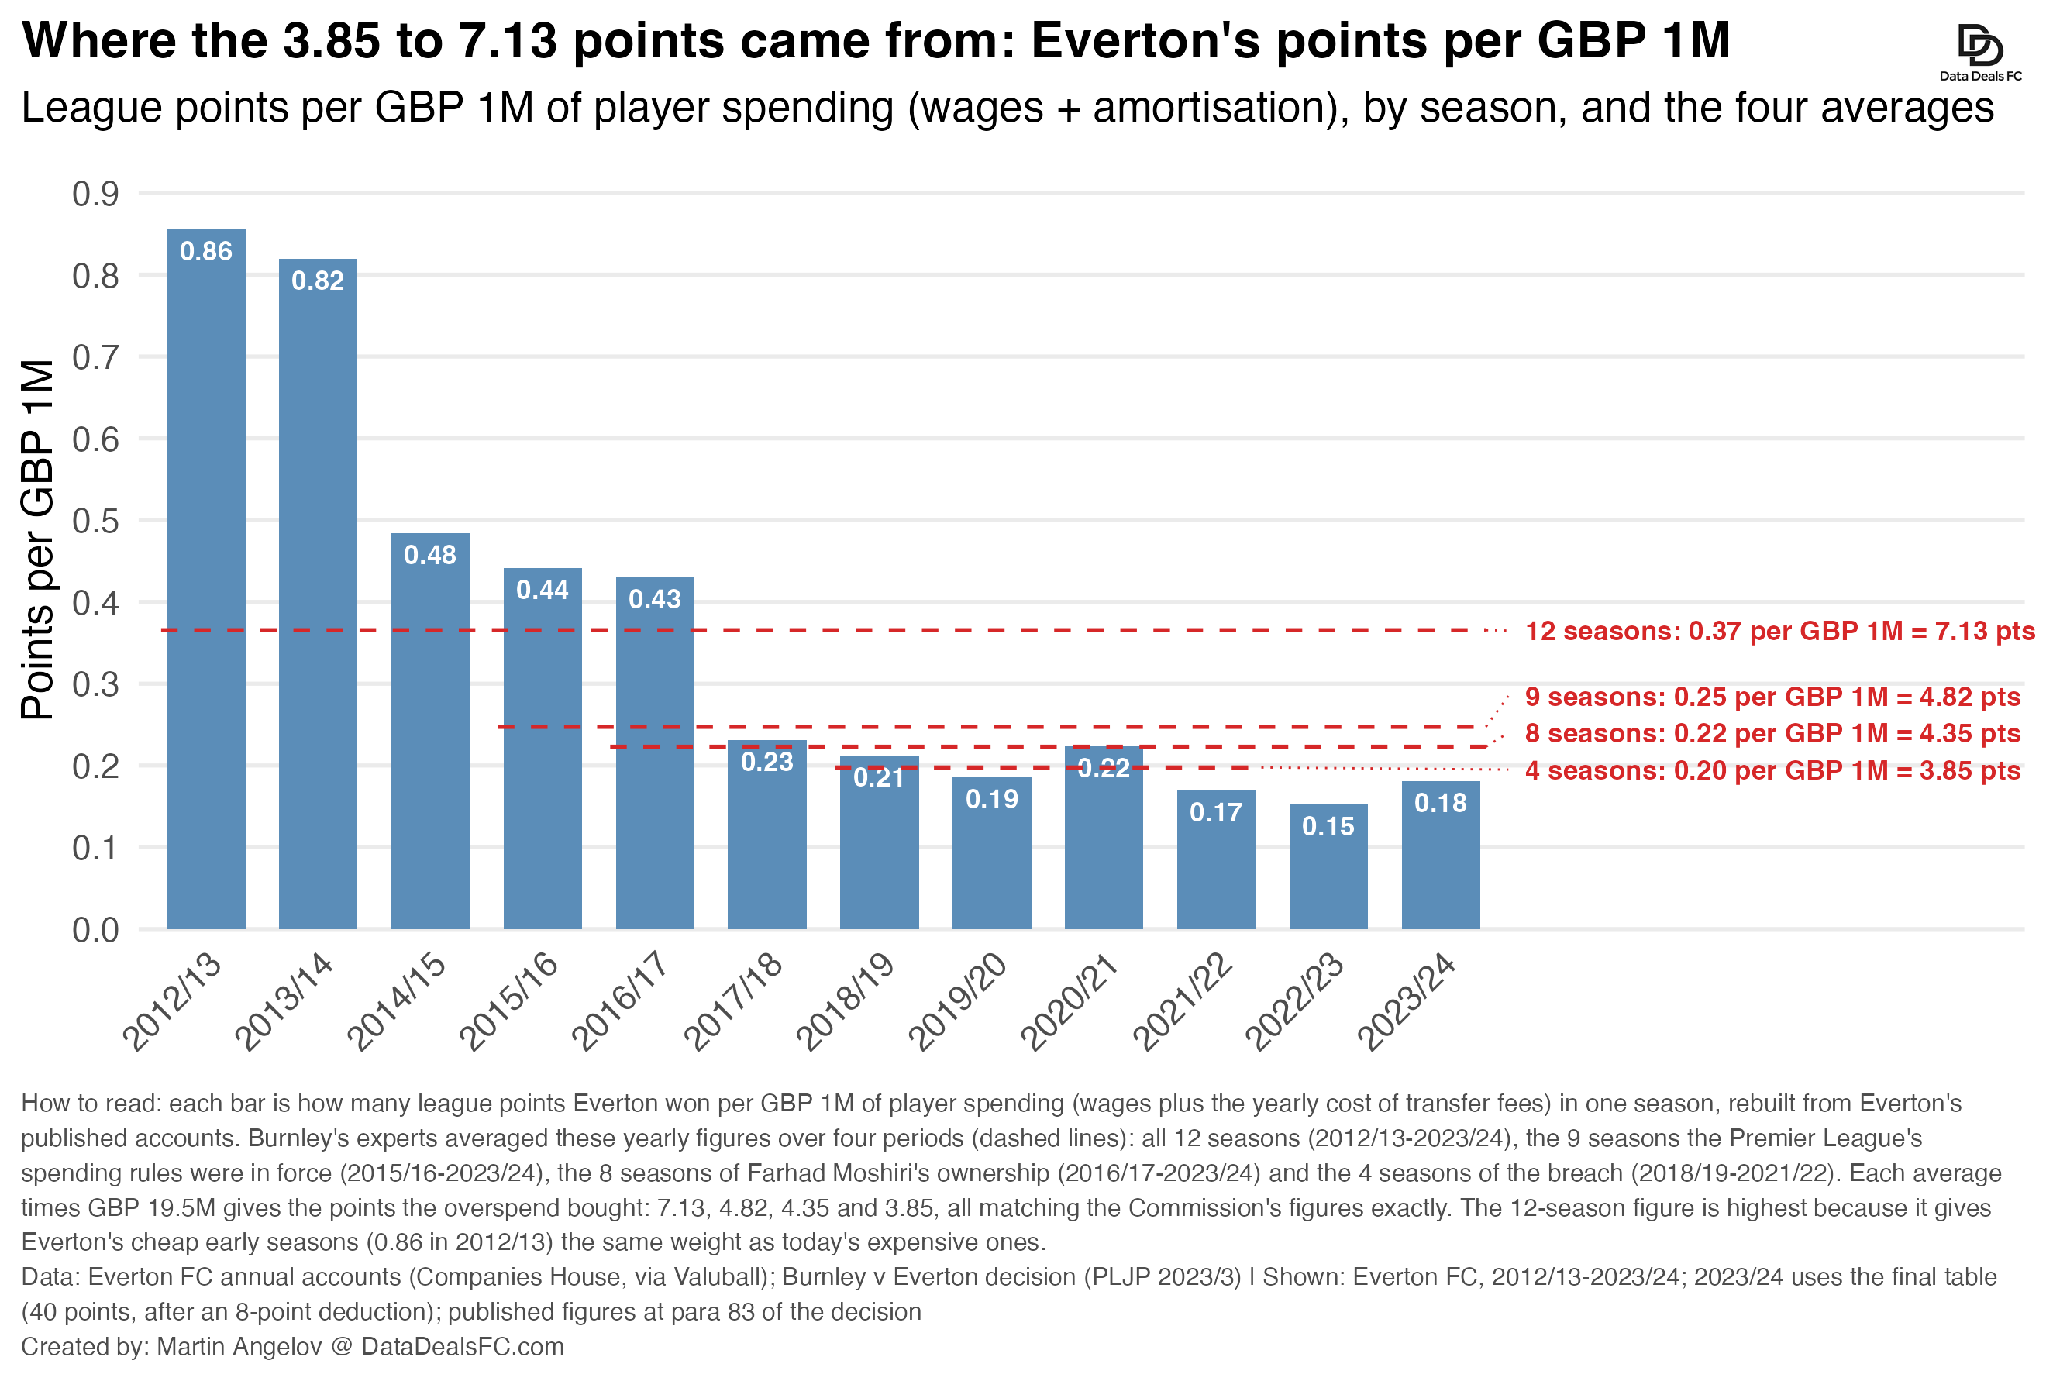
All four come out exactly.
But the chart also exposes the weakness of Burnley’s preferred 7.13-point estimate. In 2012/13, Everton won 0.86 points for every £1M it spent on players. By 2021/22, that had fallen to 0.17. Everton had not suddenly become five times worse at spending money. Football had simply become much more expensive while the number of points available remained the same.
Everton made exactly that argument.
Once earlier seasons were adjusted for the growth in Premier League spending, Burnley’s four estimates narrowed to roughly 3.7 to 4.7 points. The Commission accepted that Everton’s criticism had ‘some force’ and did not rely on the 7.13-point estimate. Even without the 7.13, every other estimate, adjusted or not, sat between 3.66 and 4.82 points: close to, or above, the four that mattered.
And that matters because Everton finished exactly 4 points above Burnley.
Everton’s expert had a very different answer
Everton’s expert, Derek Holt, asked a different question.
Burnley’s experts asked:
how many points has Everton historically won for each £1M it spent?
Holt asked:
when two clubs meet, how much does the gap in their spending change the result?
To answer it, he took every Premier League match in the four breach seasons and measured how much more the home side spent on players than the away side. Then he estimated how the chances of a home win, a draw and an away win shift as that gap grows. (The statistical tool is called an ordered logit; the gap is measured as a ratio of the two clubs’ spending.) With that in hand, he could take money away from Everton, replay its matches, and count the points it would have lost.
The decision describes the model well enough to rebuild it, so I did, from the same club accounts and every result from 2018/19 to 2021/22. The easiest way to see what it does is one match.
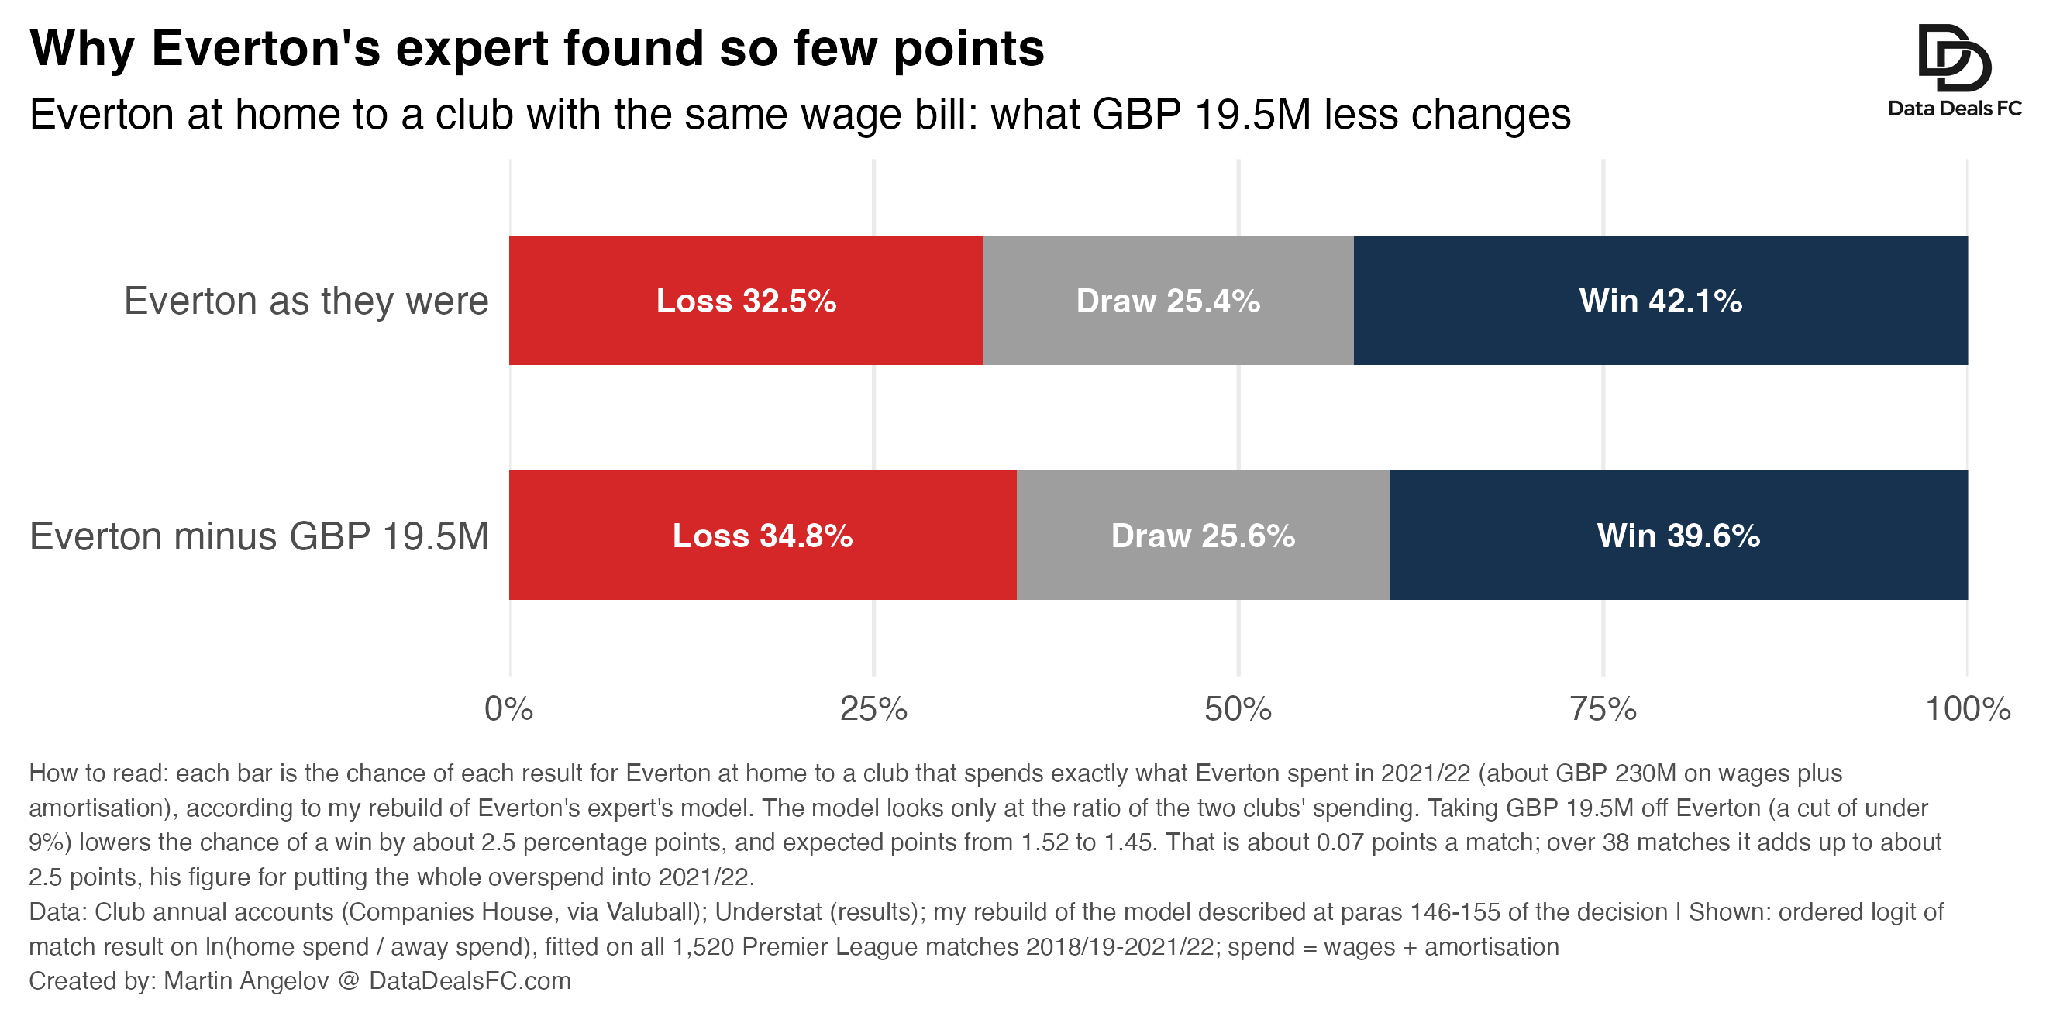
Put Everton at home to a club with exactly the same wage bill. The model gives Everton a 42% chance of winning, worth about 1.52 points on average. Now take £19.5M off Everton. It spent about £230M on players that season, so that is a cut of under 9%, and the chance of winning drops to about 40%: roughly 1.45 points. The difference is 0.07 points a match. Over 38 matches it adds up to about 2.5 points.
That is the first reason his number is smaller. His model is built on spending relative to the rest of the league, and in it £1M is worth about 0.13 points. Everton’s own record over the breach seasons said 0.20.
The second reason is how much of the £19.5M he counted against 2021/22. The assessment period covered four seasons but, because of Covid, the rules averaged 2019/20 and 2020/21 together, so it had three parts. Holt’s preferred version spread the overspend evenly, £6.5M for each part, which leaves only a third of it in 2021/22. Spreading it in proportion to Everton’s losses leaves just £1.6M. Only when he put all £19.5M into 2021/22, a version he himself called unrealistic, did he reach 2.6 points.
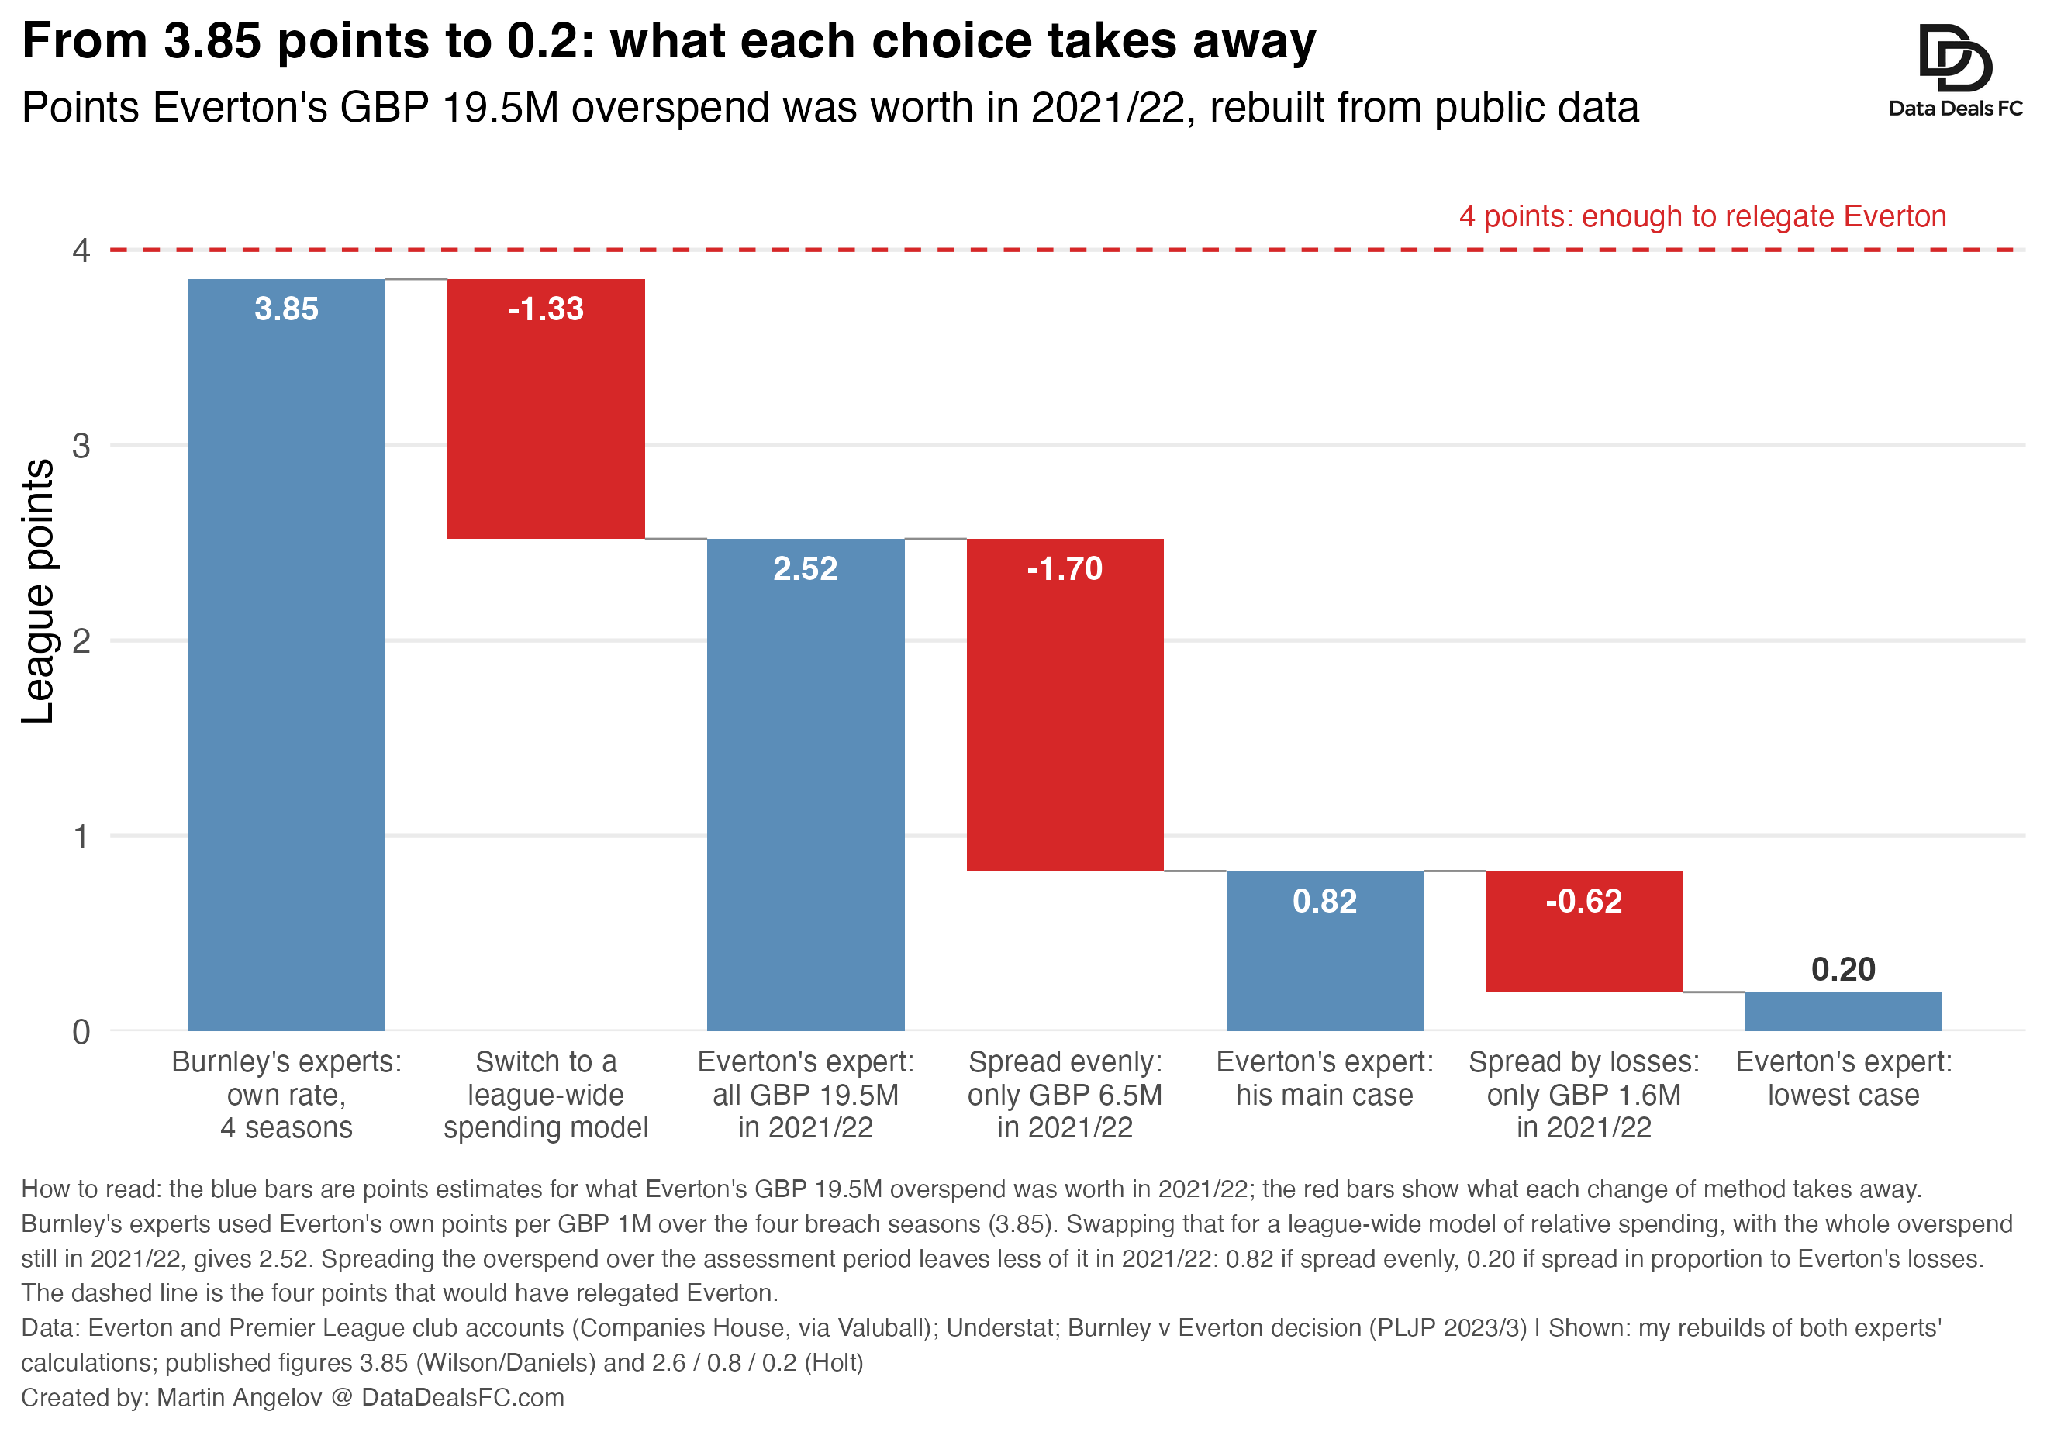
My rebuild gives 2.52, 0.82 and 0.20 points for those three versions, against his published 2.6, 0.8 and 0.2. It also picks the right result in 55.3% of 2021/22 matches, against the 55.0% he reported and about 59% for the bookmakers.
There is one more thing the rebuild shows. Fed only spending, the model expected Everton to win about 54 points in 2021/22. They won 39. That was the Commission’s criticism: before any adjustment, his model’s league table was simply the clubs ranked by what they spent.
So the disagreement was not really about arithmetic. Both sides’ numbers can be rebuilt from public accounts almost to the decimal. It was about
which model should turn money into points, and how much of the money belonged to the season that mattered.
The Commission preferred Burnley’s approach. Among other things, it found Holt’s model less compelling because it reduced football almost entirely to spending and predicted match results less accurately than the bookmakers.
Which exchange rate?
This is the first question that becomes especially important for Manchester City. The exercise is, in effect, about choosing an exchange rate between pounds and points.
The club’s own rate. This is essentially Burnley’s approach: use the offending club’s own historical points per £1M.
The league-wide rate. Estimate how much an additional £1M is associated with across all Premier League clubs.
The rate at the top. If returns diminish as spending rises, another £1M may buy much less for an already dominant club than for a mid-table one.
Burnley v Everton does not settle that question for a club like City. The diminishing-returns discussion in the case specifically recognised that the position could be different for the biggest spenders.
I’ll come back to that when we run the numbers for individual City rivals.
For now, the Commission had an estimate of how many points Everton’s overspend may have bought. But four fewer points does not automatically mean Burnley stay up.
For that, they had to replay the season.
Step 4: Turn points into relegation
The experts took pre-season bookmaker ratings for all twenty Premier League clubs, weakened Everton by the estimated effect of the overspend, and simulated Everton’s 38 matches 100,000 times.
Every match not involving Everton stayed exactly as it happened.
Then they asked a simple question:
Who ends up in the bottom three more often: Everton or Burnley?
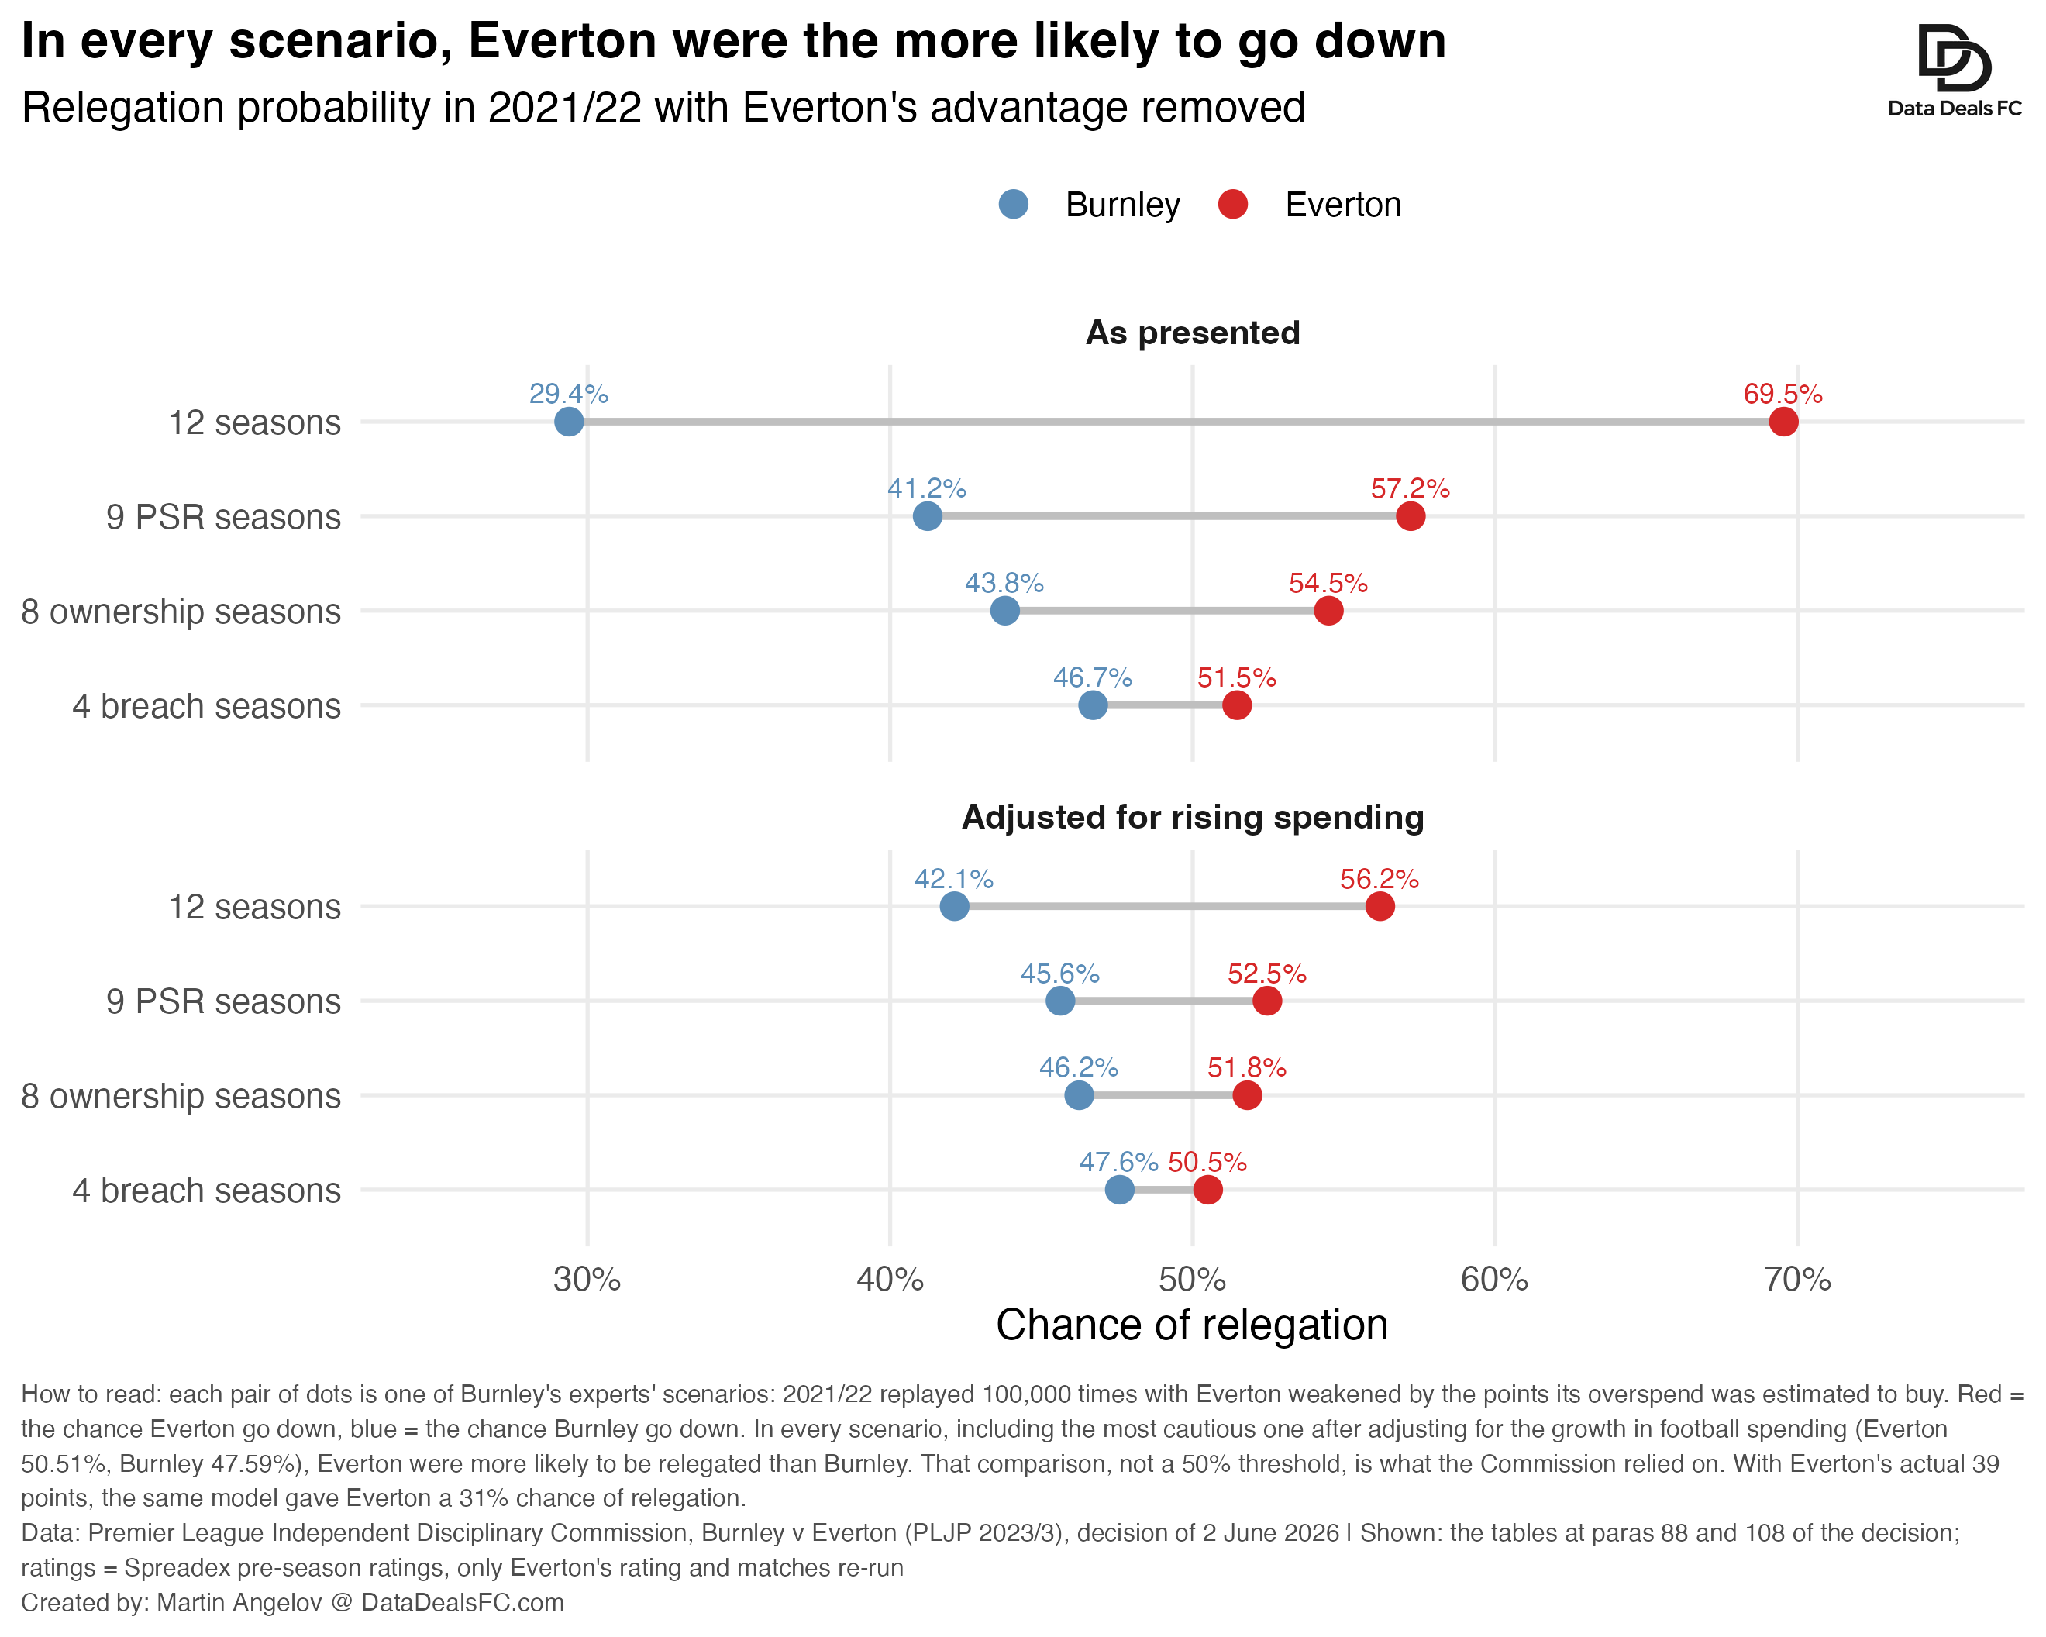
In every scenario, the answer was Everton. Even in the most cautious version, Everton were relegated in 50.51% of the simulations and Burnley in 47.59%.
That difference looks tiny. But legally, it was enough.
The Commission was applying the civil standard of the balance of probabilities. It did not need Burnley to prove with certainty that Everton would have gone down.
It needed to decide whether, without the advantage created by the breach, it was more likely than not that Everton rather than Burnley would have occupied the relegation place.
Every scenario pointed the same way.
I rebuilt this too
The experts’ Spreadex ratings are private, so I could not reproduce them directly. Instead, I used Pinnacle’s closing odds for every Premier League match in 2021/22 to build my own market-based ratings. Then, for each of Burnley's experts' eight estimates (3.66 to 7.13 points), I weakened Everton by that many points and replayed its season 100,000 times.
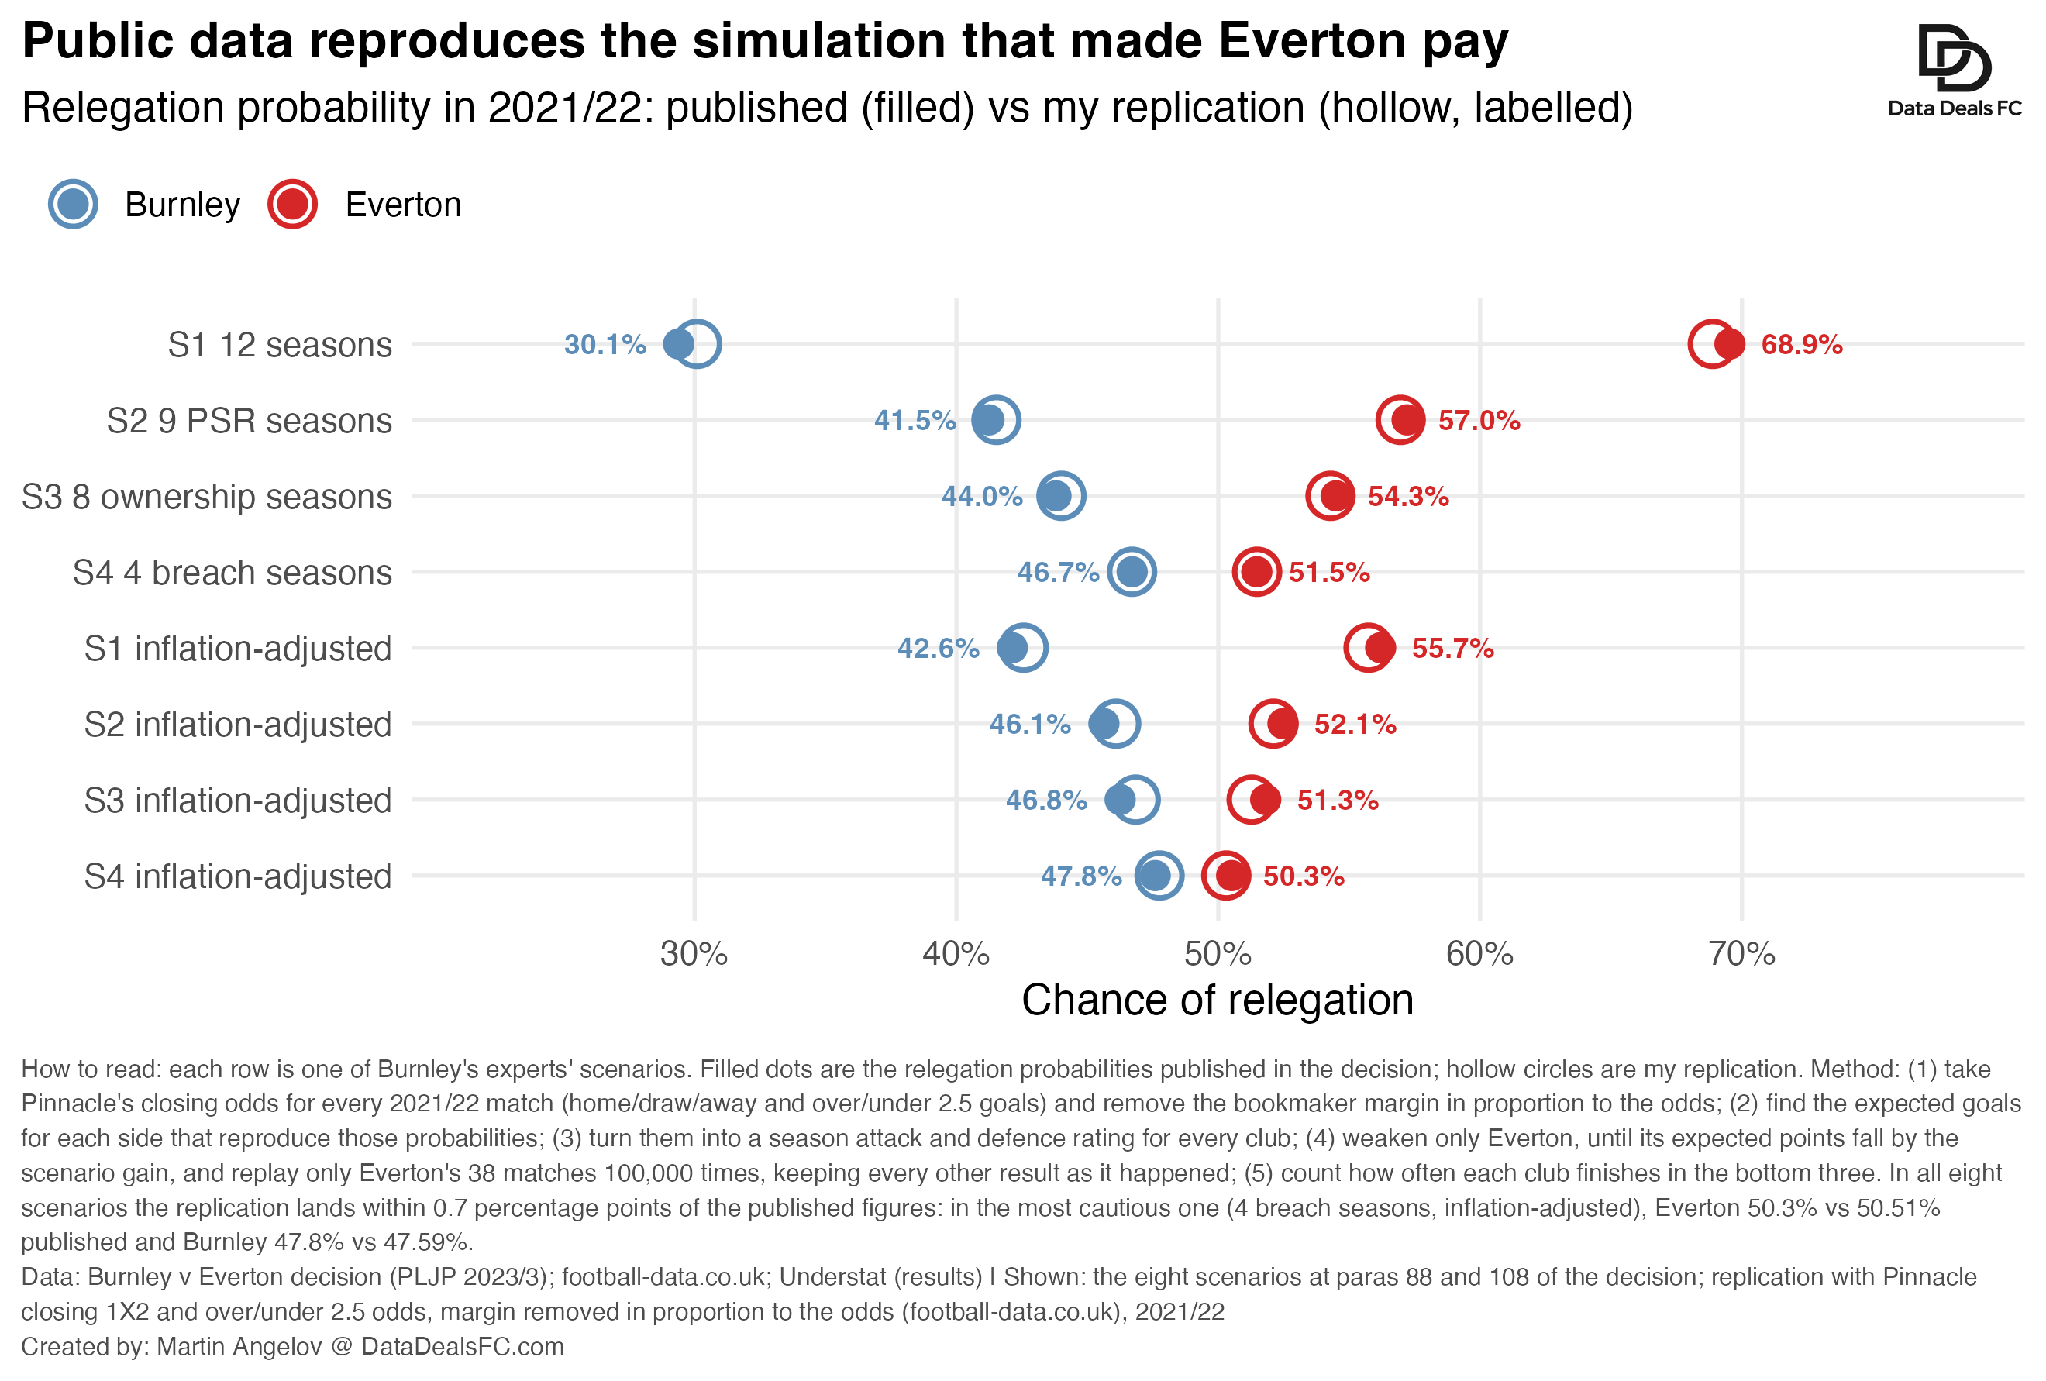
Across all eight scenarios, my relegation probabilities come within 0.7 percentage points of the published figures. In the most cautious scenario, I get Everton at 50.3%, against the experts’ 50.51%. Burnley comes out at 47.8%, against 47.59%.
So the core method behind the decision can be reconstructed almost entirely from public data.
And once the Commission accepted that Everton’s breach had caused Burnley’s relegation, the question changed again.
It was no longer: did Burnley lose money?
It was: how much?
Step 5: Turn relegation into £35M
This is where the accountants took over.
Burnley’s loss was measured as the difference between what actually happened after relegation and what the club would probably have earned had it stayed in the Premier League.
But there is an obvious problem: nobody knows what Burnley’s next four seasons would have looked like if it had survived in 2022.
So Burnley’s accountant built four alternative paths.
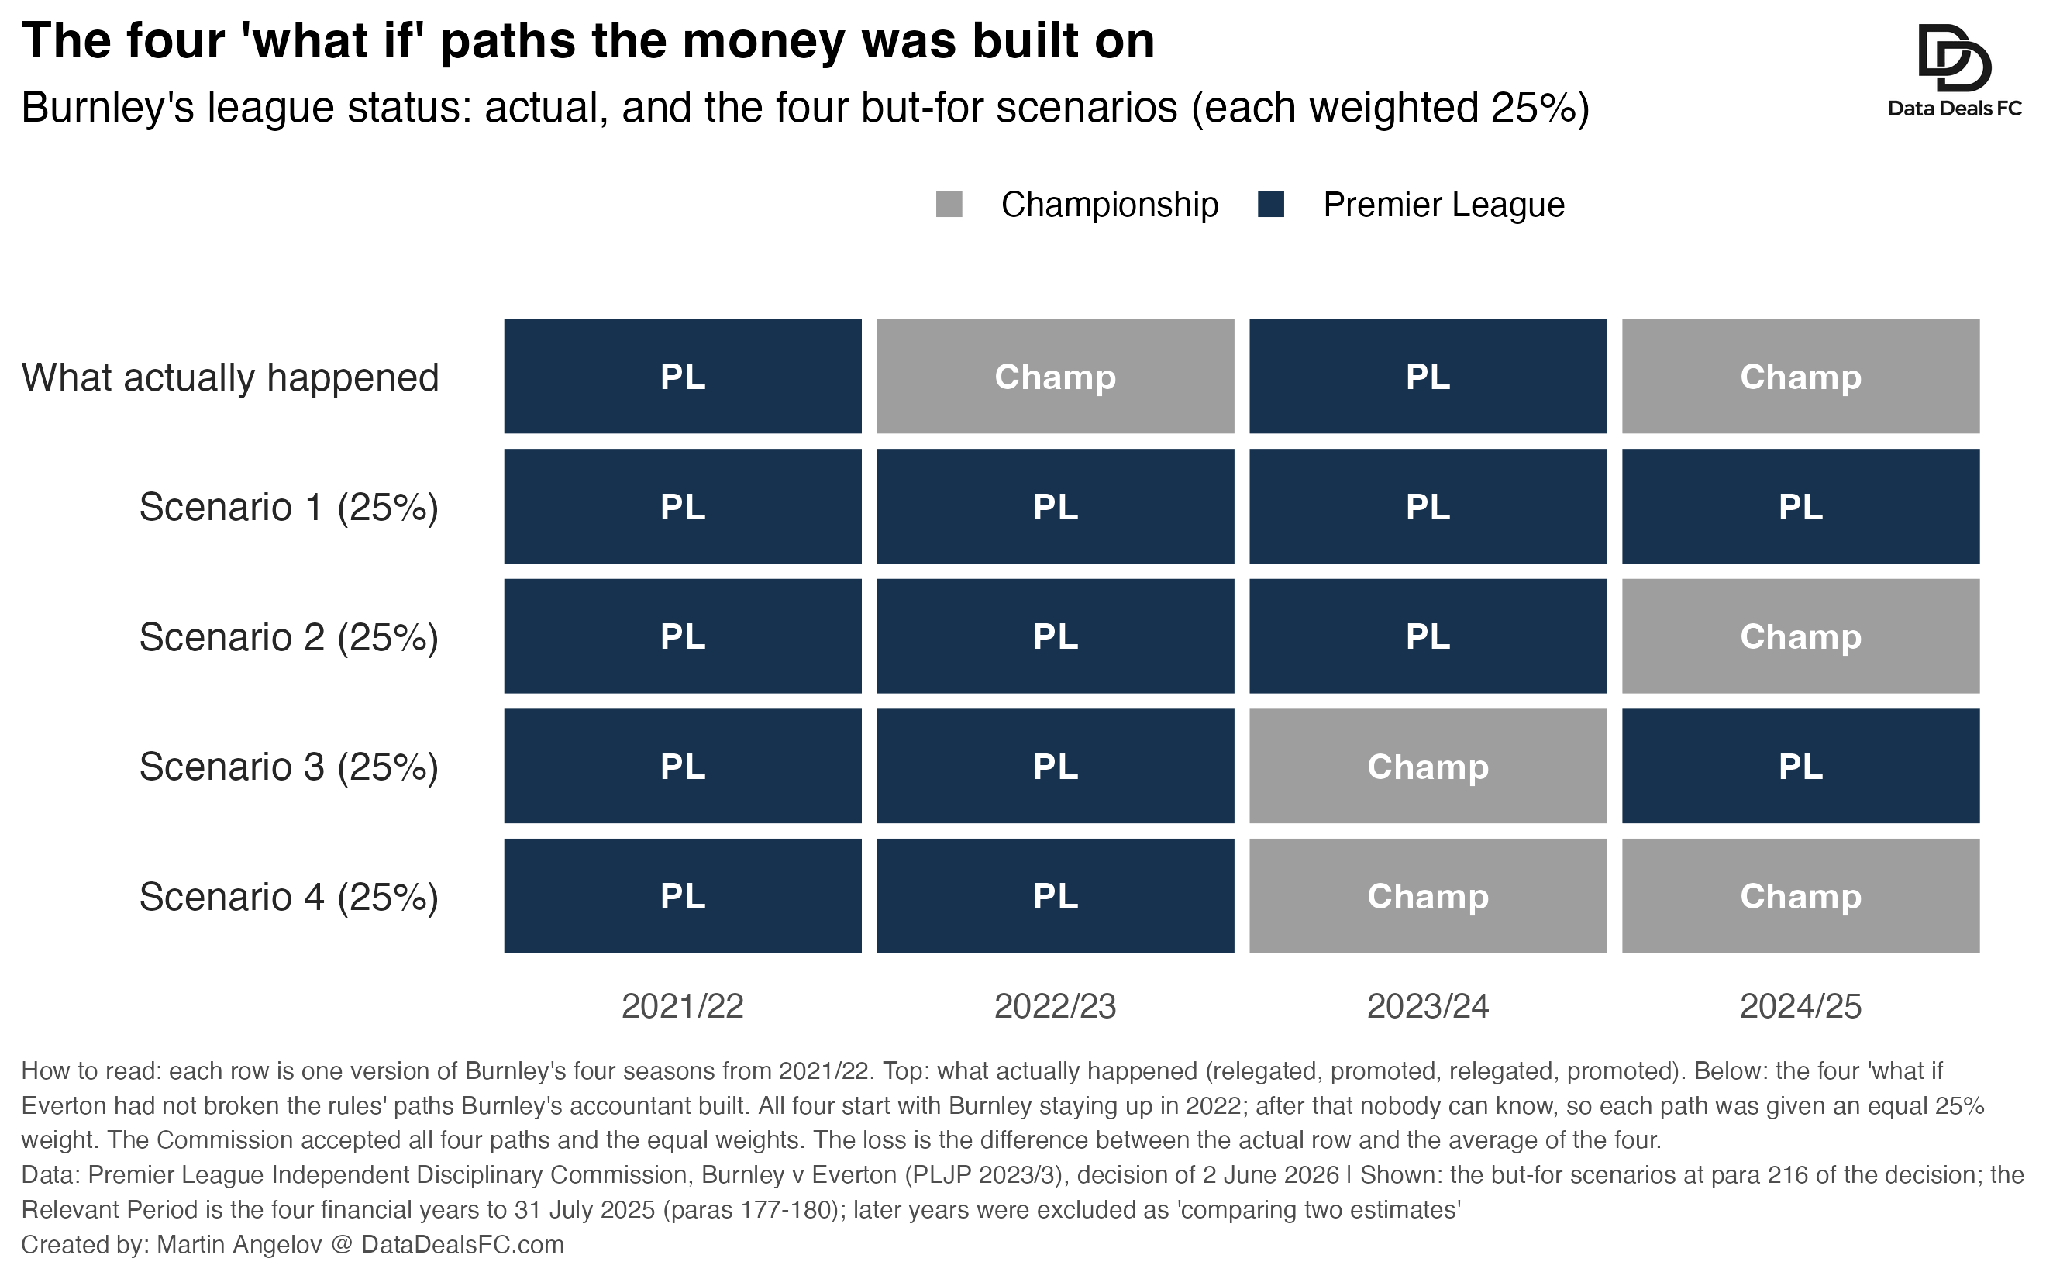
In every one, Burnley stays up in 2021/22. After that, the assumptions change: in some paths it remains in the Premier League; in others it is relegated later. Each scenario received an equal 25% weight.
And here the experts disagreed even more dramatically than they had over points.
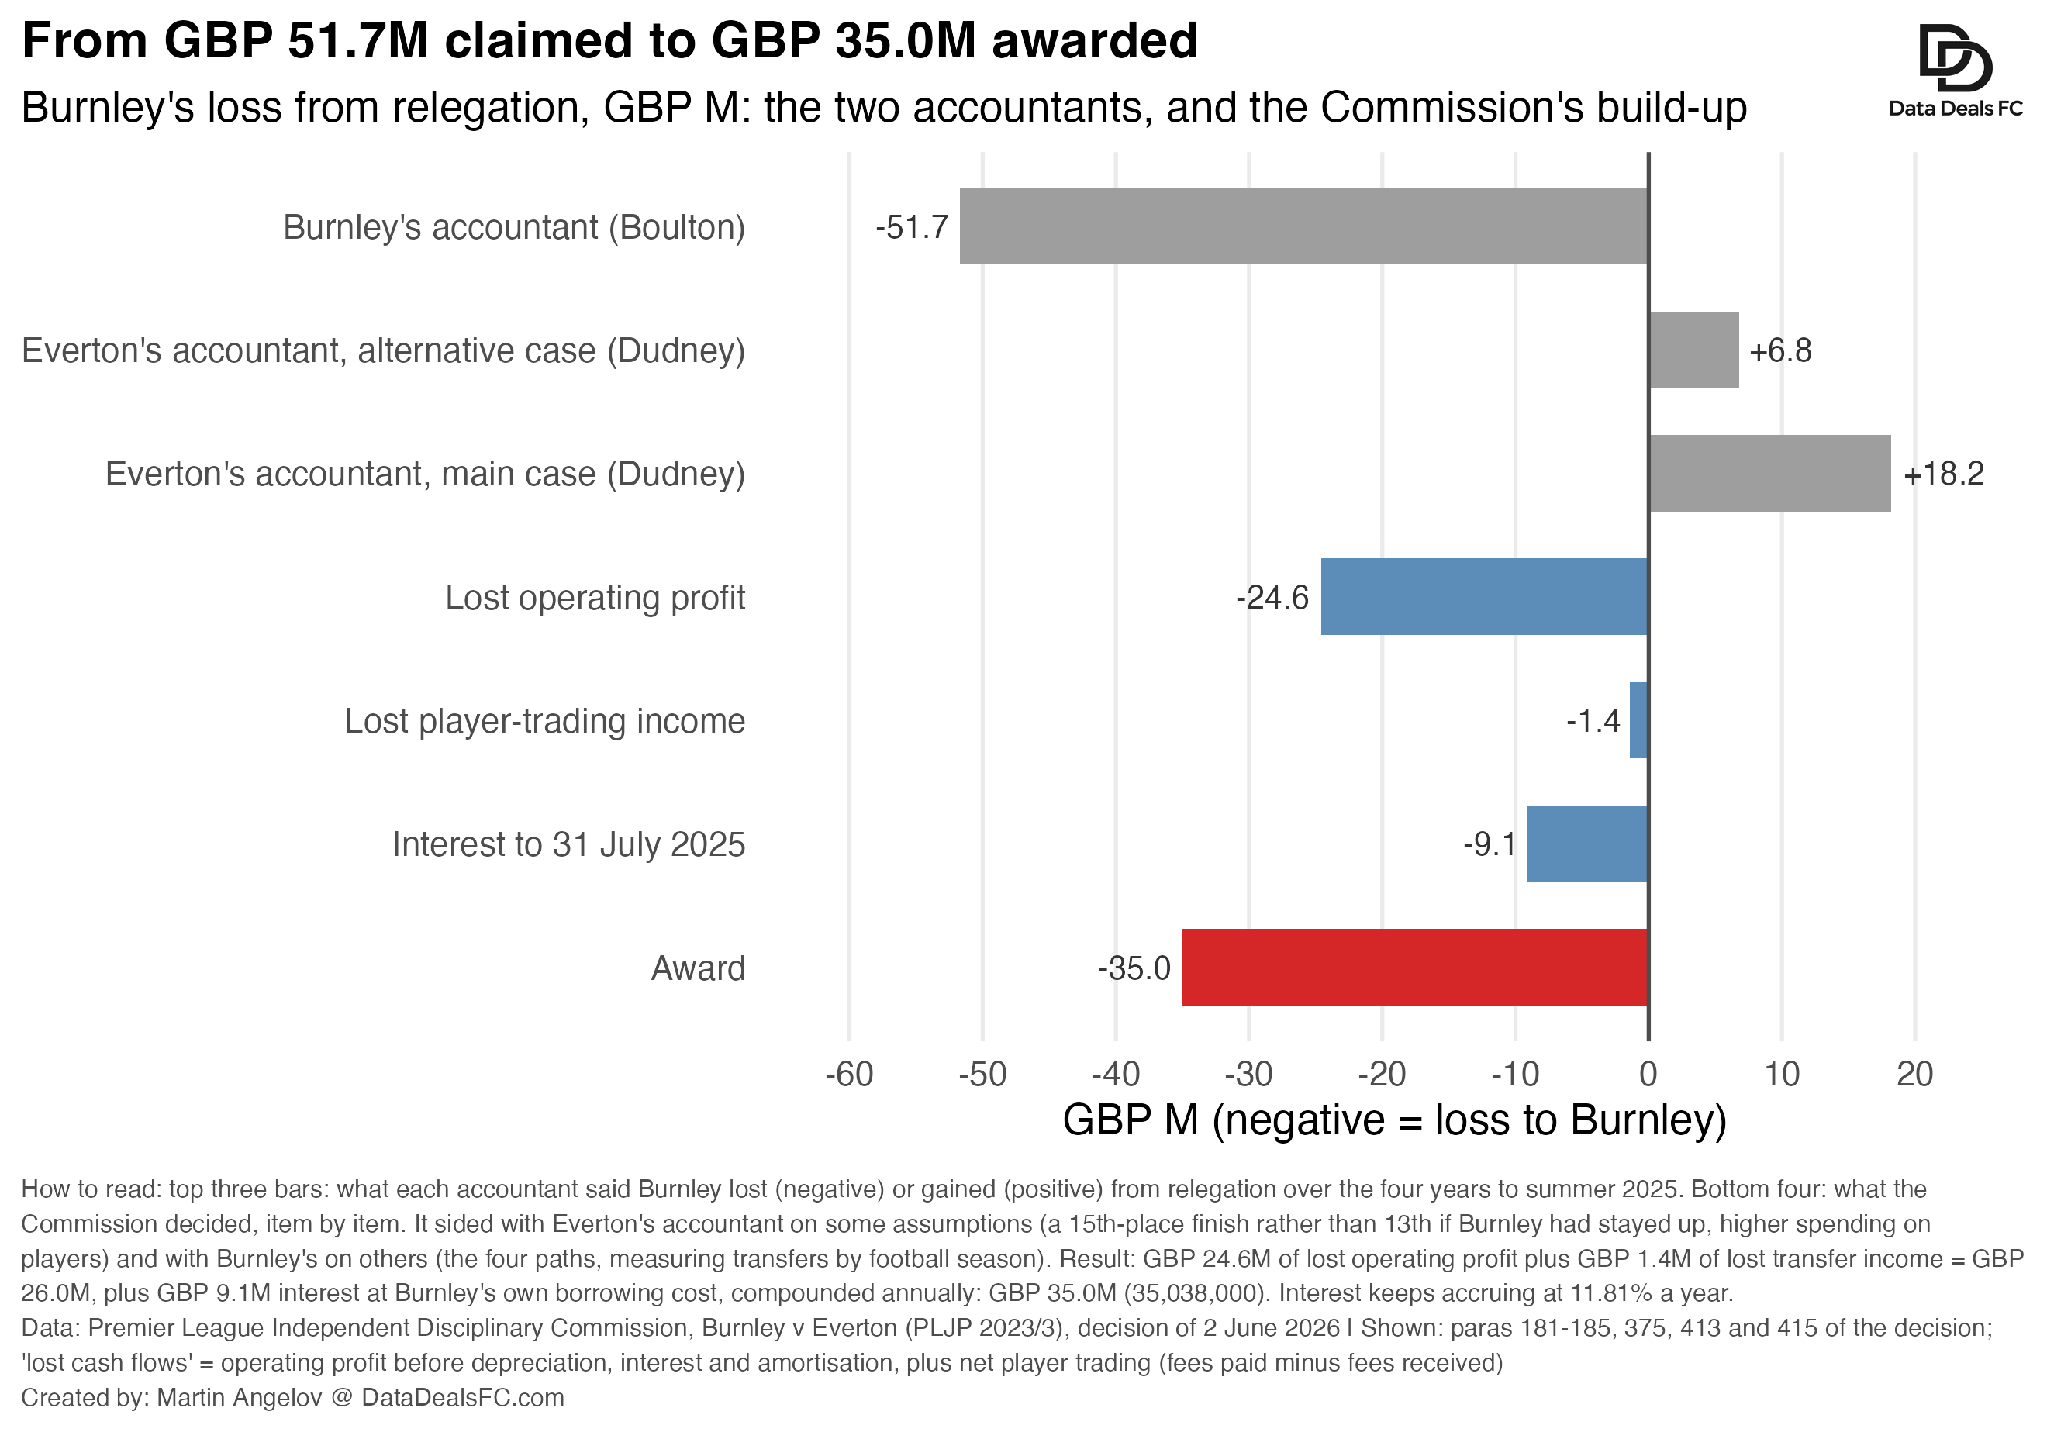
Burnley’s accountant calculated a loss of £51.7M.
Everton’s accountant said Burnley had lost nothing. On his main case, Burnley was actually £18.2M better off because relegation reduced costs and generated player-sale income.
The Commission landed between the two.
One important adjustment went Everton’s way: Burnley had assumed it would finish 13th in the Premier League; the Commission considered that too optimistic and used 15th instead.
After working through the different assumptions, it arrived at:
£24.6M of lost operating profit
£1.4M of lost player-trading income
That gave a loss of £26M.
Step 6. Add interest
Then came something that could become particularly important for City’s older seasons: interest.
The Commission used Burnley’s average borrowing costs and compounded them annually. That added another £9.1M.
And that is how a £26M of loss became a £35M award.
What the precedent does, and does not, tell us about City
Put the steps together and a claim against City would have to do six things:
rest on breaches the panel actually found;
build a realistic “what if” world;
turn the money into points;
show, through a simulation, that without City’s advantage the claimant was more likely than City to finish on the right side of the line that mattered;
price the seasons that followed; and
add interest.
1. Established breaches
The published core decision changes the first step substantially. The Commission found that City’s income was overstated by more than £830M between 2009/10 and 2017/18, through what it calls a Disguised Funding Scheme, and that City breached both the Premier League’s and UEFA’s spending limits “by a very substantial amount” in every season charged, even on City’s fallback case that the sponsorship deals should simply be revalued at a fair market price. That is a far larger breach than Everton’s £19.5M. The season-by-season figures are in appendices that have not yet been published, and City have until 2 October to appeal. Whether the findings would bind later compensation claims in the same way as the Everton findings bound Burnley’s would depend on the rules that apply and on the outcome of any appeal; the structure of the Premier League’s rules suggests they would, but that is for lawyers to confirm.
What Burnley v Everton gives claimants is a tested method and a set of reasoned answers to the obvious objections. What it does not give them is a guarantee. It is a decision of one commission on one club’s facts, not binding precedent, and several of its findings would be argued afresh in a City case:
2. The “what if”
Everton could not show a realistic way to raise £19.5M without weakening the team. City would argue that a club of its commercial pull could have raised similar sums legitimately, from genuine sponsors or owner funding within the limits. The counter-argument is the Commission’s own finding: the deals were shams precisely because the sponsors were not paying the recorded fees.
3. The exchange rate
The Commission’s finding on diminishing returns was about Everton, a mid-table spender. It did not decide what rate applies to a club at the very top, and City would argue that an extra pound bought very little there. Claimants would reply that the Commission accepted the benefit of overspending is cumulative, and that City’s alleged funding ran across nine seasons. The cumulative finding was made on Everton’s facts; whether it carries over is part of the argument.
4. The places at stake
Burnley lost Premier League status. City’s rivals mostly lost titles, worth a few million pounds in prize money, or Champions League places, worth tens of millions a season.
As for the comparison, in Burnley’s case the question came down to whether Everton, without the advantage, were more likely than Burnley to be the club relegated. A rival of City would need to show something similar for the place it lost. And because Burnley recovered its full loss once causation was established, the same approach would apply in principle, although a different tribunal could be asked to take a different view on the facts.
5. Time & Interest
In English law, claims for breach of contract generally have to be brought within six years, but where a breach has been deliberately concealed the period does not start until the victim discovered it, or could reasonably have done so. Those are established rules. Whether they apply to compensation claims under the Premier League’s rules, and if so when time started running (Der Spiegel’s reports in 2018, the charges in 2023 or the Commission’s decision), are open questions, and could be the first battle any claim faces. The Commission’s findings that City concealed the scheme from its auditors and regulators would be central to that argument. Burnley v Everton did not deal with time limits at all.
And finally, a claim about seasons from a decade ago would carry a decade of interest, on whatever basis a tribunal chose.
Boom — that was the precedent all economic consultants will likely rely on to build their follow-on damages cases against Manchester City.
Thank you for reading until the end ❤️
I hope this makes the claims to come easier to follow.
In Part 3, I’ll run the same playbook for Arsenal: what their economists could argue, where the numbers take us, and how City’s side would likely push back.
Subscribe to not miss it.
See you next week,
Martin
P.S. This post was AI-assisted. The model wanted a share of the £35M. I told it to prove causation first. It couldn’t.
Method note on Everton’s relegation simulation
Odds into probabilities. For each 2021/22 match I took Pinnacle’s closing odds for home win, draw and away win, and for over and under 2.5 goals. Converting odds to probabilities (1 ÷ odds) gives totals slightly above 100%, the bookmaker’s margin. For Everton v Southampton on 14 August 2021 (2.05, 3.45, 4.07), that total is 102.3%. I removed the margin in proportion to the odds, giving Everton 48.0%, draw 28.2%, Southampton 23.8%. Scaling all three down equally instead changes the final relegation probabilities by less than half a percentage point.
Probabilities into expected goals. Assuming each side’s goals follow a Poisson distribution, I found the pair of expected-goal values whose implied result and over/under probabilities best match the market: for that match, Everton 1.43, Southampton 0.93. The result odds pin down the gap between the teams; the over/under odds pin down how many goals to expect. Using the result odds alone gives the same conclusion in every scenario, slightly less precisely.
Ratings and simulation. Across all 380 matches, the expected goals give each club an attacking and a defensive rating, adjusted for opponents and home advantage. In each scenario I lowered Everton’s ratings until its expected points fell by the scenario’s points estimate, replayed Everton’s 38 matches 100,000 times with every other result held at its actual value, and counted bottom-three finishes.
Sources: Premier League Independent Disciplinary Commission (David Phillips KC FCIArb, HH Alan Greenwood, Nick Igoe ACA), Burnley Football & Athletic Company Limited v Everton Football Club Company Limited, PLJP 2023/3, decision and summary dated 2 June 2026, published 10 June 2026 (redacted). Key paragraphs: procedure 10-18; status of earlier decisions 19-21; counterfactual 22-45; date of breach 46-62; causation 63-170 (results at 83, 88 and 108; diminishing returns 111-118); quantum 171-380; interest 381-414; award 415. Manchester City: Premier League statement and redacted core decision, 29 September 2026. Earlier claims: Sheffield United v West Ham (settled 2009); Middlesbrough v Derby County (settled February 2022, ITV News). My replication: Everton, Burnley and Premier League clubs’ annual accounts (Companies House, via Valuball); Pinnacle closing odds for 2021/22 from football-data.co.uk; results from Understat; code in analysis/025a, 025b, 025c and 026a. Clubs’ legal plans: The Athletic, 25 September 2026.