


Everyone has an opinion about what is going wrong at Manchester United. Today I look at the numbers behind it.
Welcome to the first Moneyball Squad Audit, where I’ll ask one question about Man United: is the money in the squad doing its job?
I’ll look at the team in three ways:
what the players are worth on the market,
what they are paid, and
how the team performs.
I’ll then put the three next to each other, against the rest of the league, and against the club’s own past.
For United that means nine completed seasons, from 2017/18 to 2025/26, plus the first five rounds of the current 2026/2027. Over that period the club spent about €3.9 billion on wages and €2.2 billion on transfer fees.
The full report runs to 86 pages and more than 21,000 words, with 59 figures. You can download it as a PDF at the end of this post. If you would rather not read all of it, here is an extended summary of what I found.
Three rules throughout. Every amount is in euros, and past transfer fees are restated in 2026 euros, so a fee paid in 2017 counts for what that money would buy today. Whenever seasons are compared, each club is measured against the league average of the same season, which removes inflation and the changes in data sources at once.
Let’s get into it.
1. Did United’s money buy results?
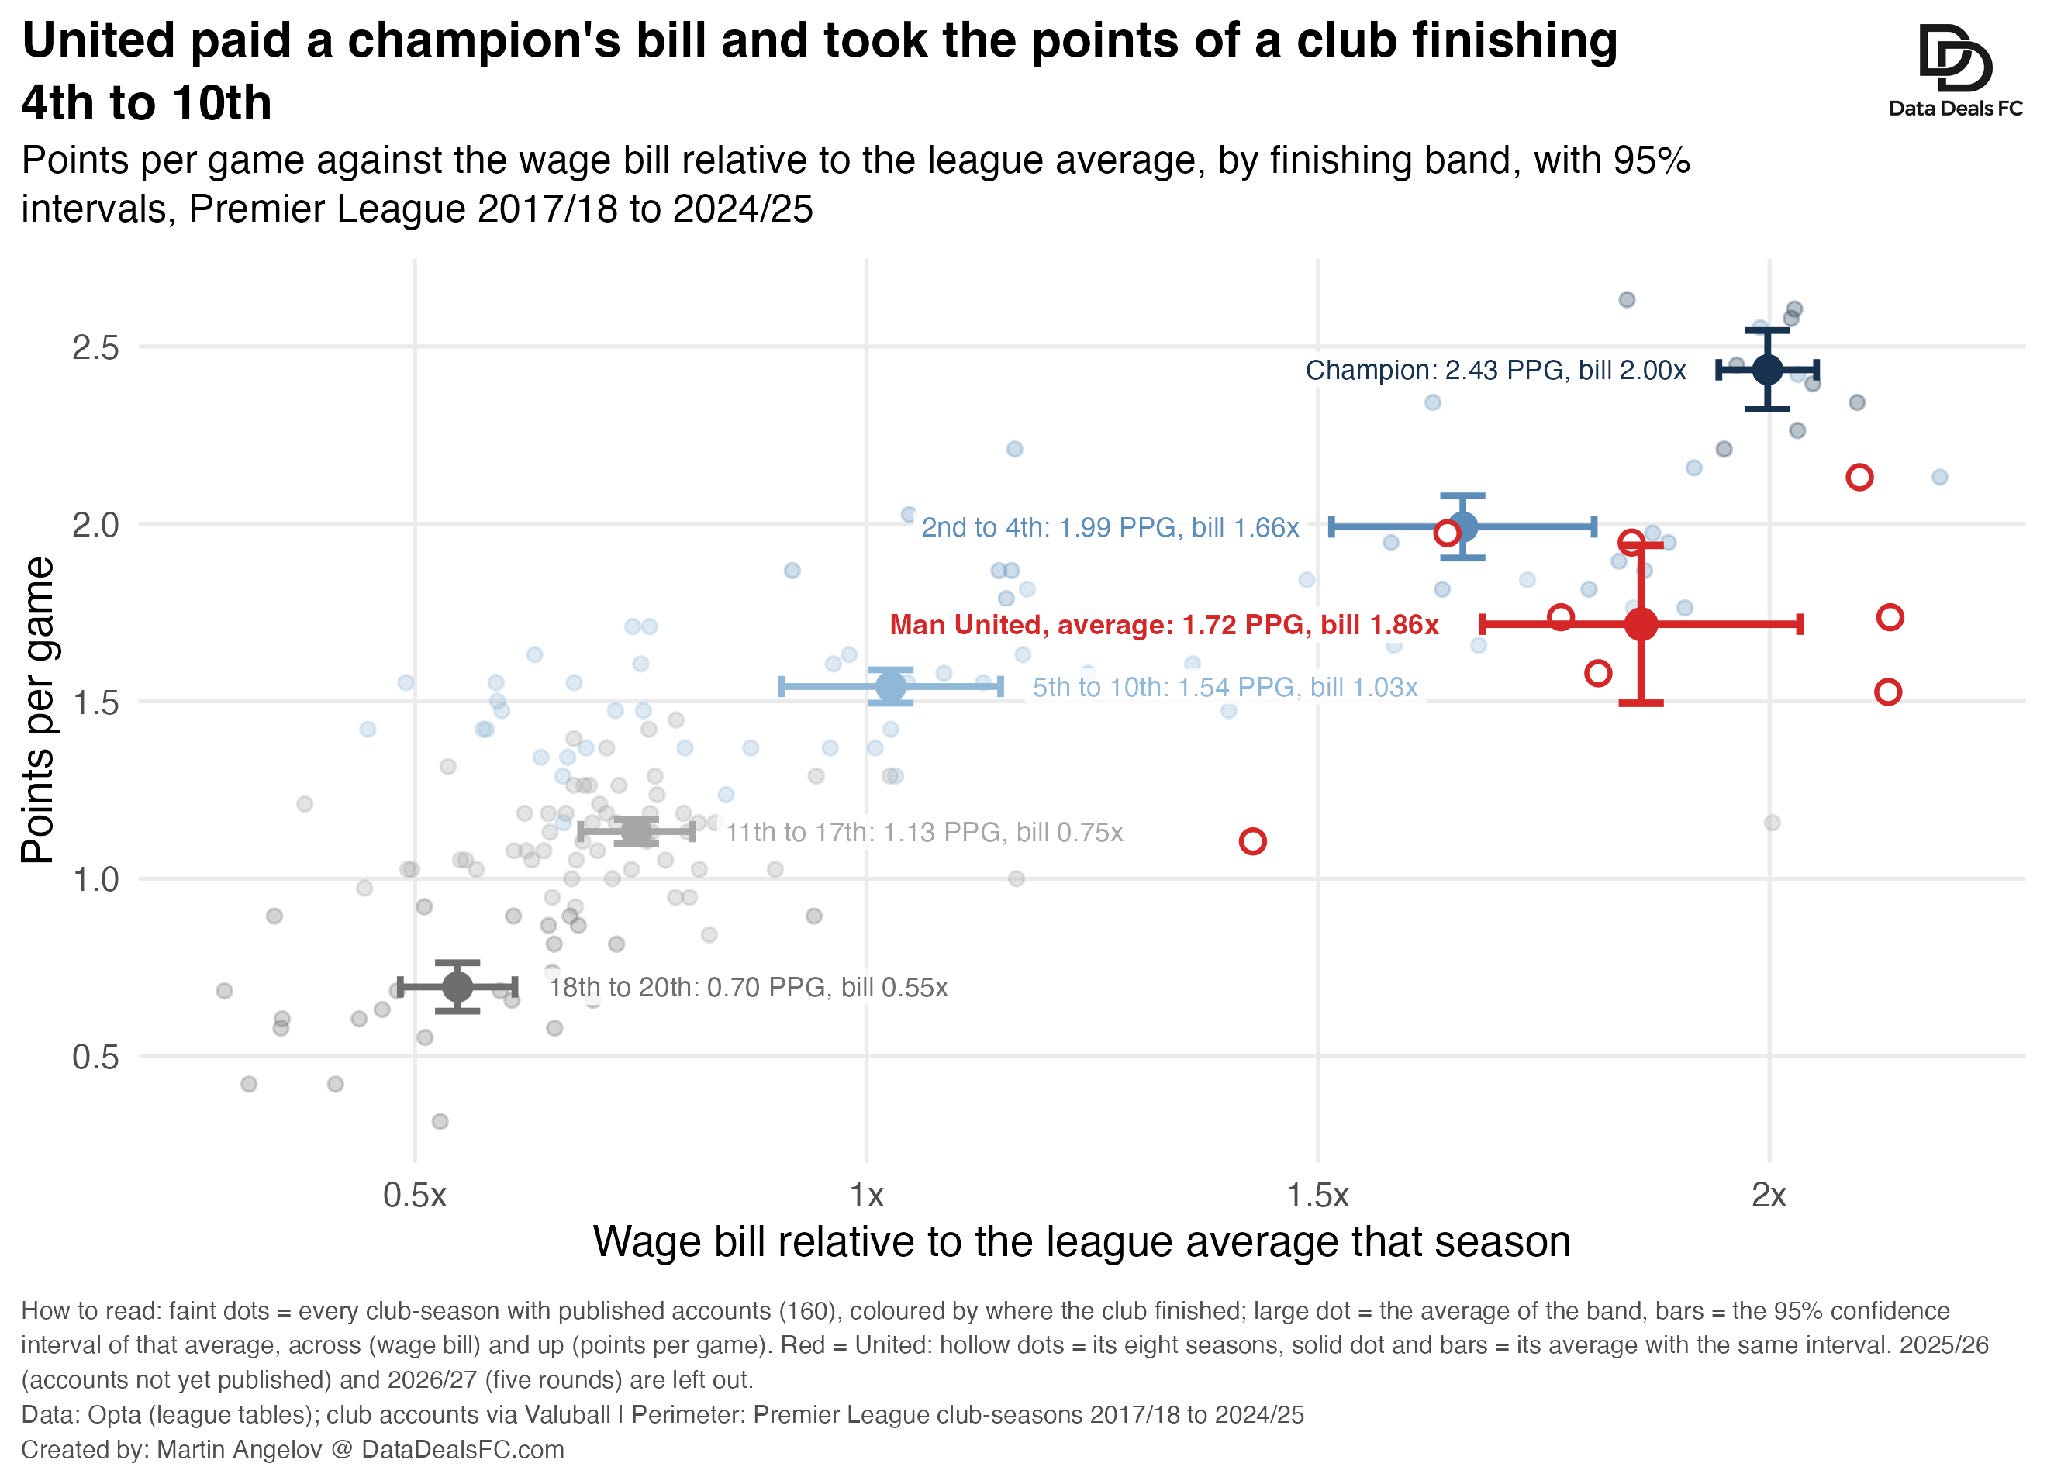
Start with the plain benchmark. Over the eight seasons with published accounts, 2017/18 to 2024/25, the clubs that won the league paid on average 2 times the league’s average wage bill and took 2.43 points per game. Clubs finishing 2nd to 4th paid 1.7 times and took 1.99.
United paid 1.86 times the league average. Almost the bill of a champion. But it took 1.72 points per game, or about 65 points a season: the return of a club finishing 5th-6th.
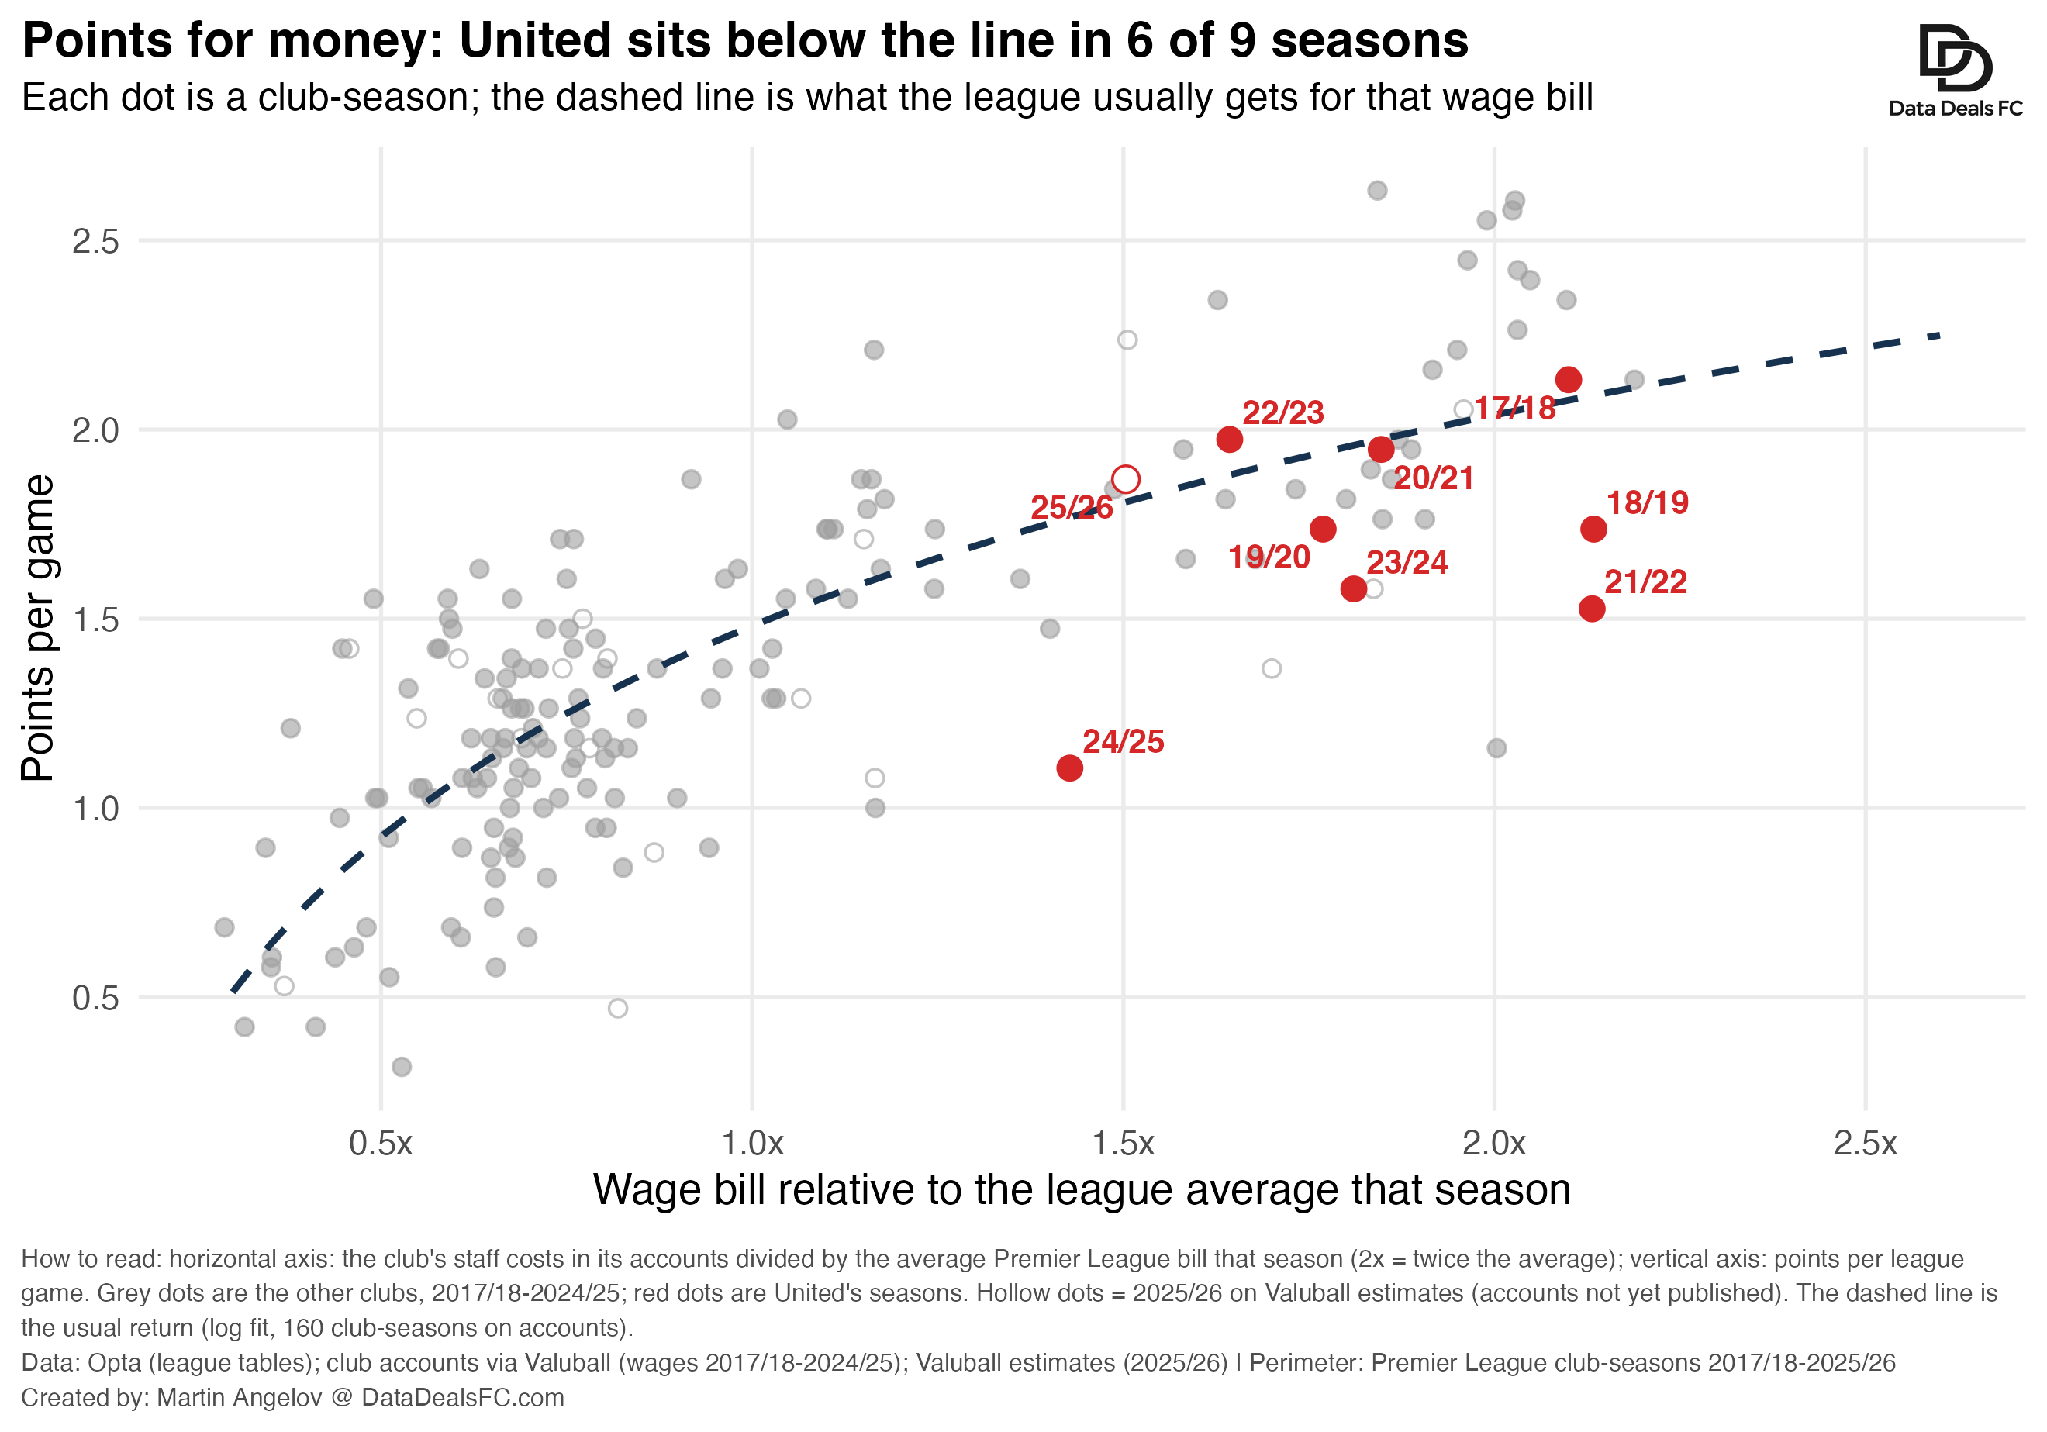
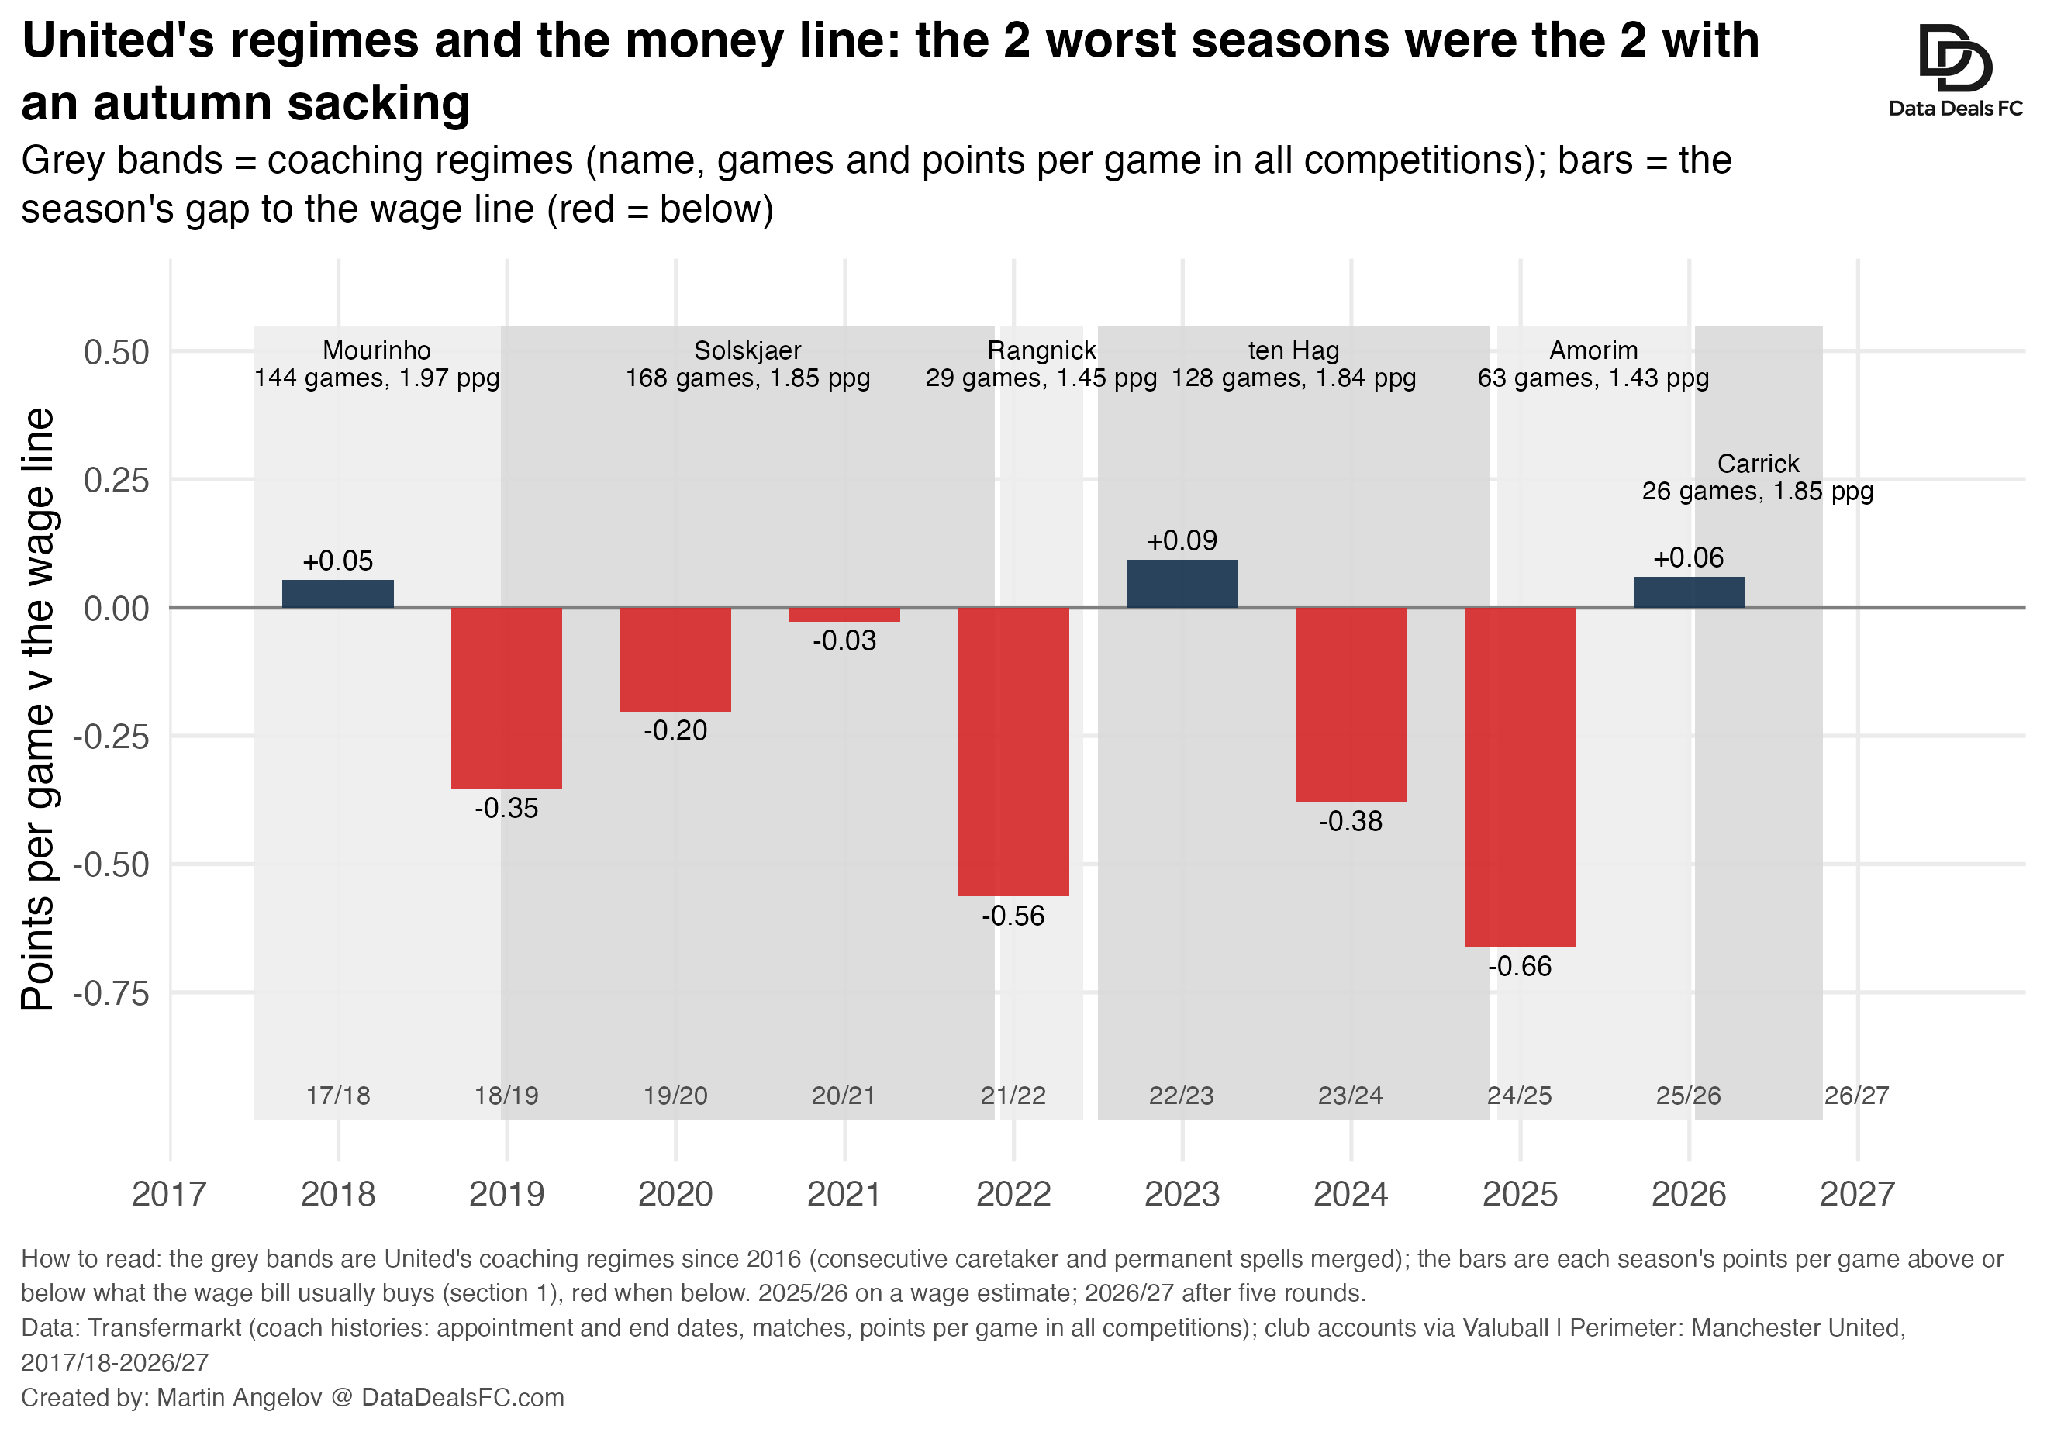
That gap is not the product of one bad season. Drawing the league’s usual return as a line, United sat below it in six of nine seasons. The worst was 2024/25, 0.66 points per game below the line, when the league’s 5th-largest wage bill finished 15th. In 2021/22 the largest bill in the league finished 6th.
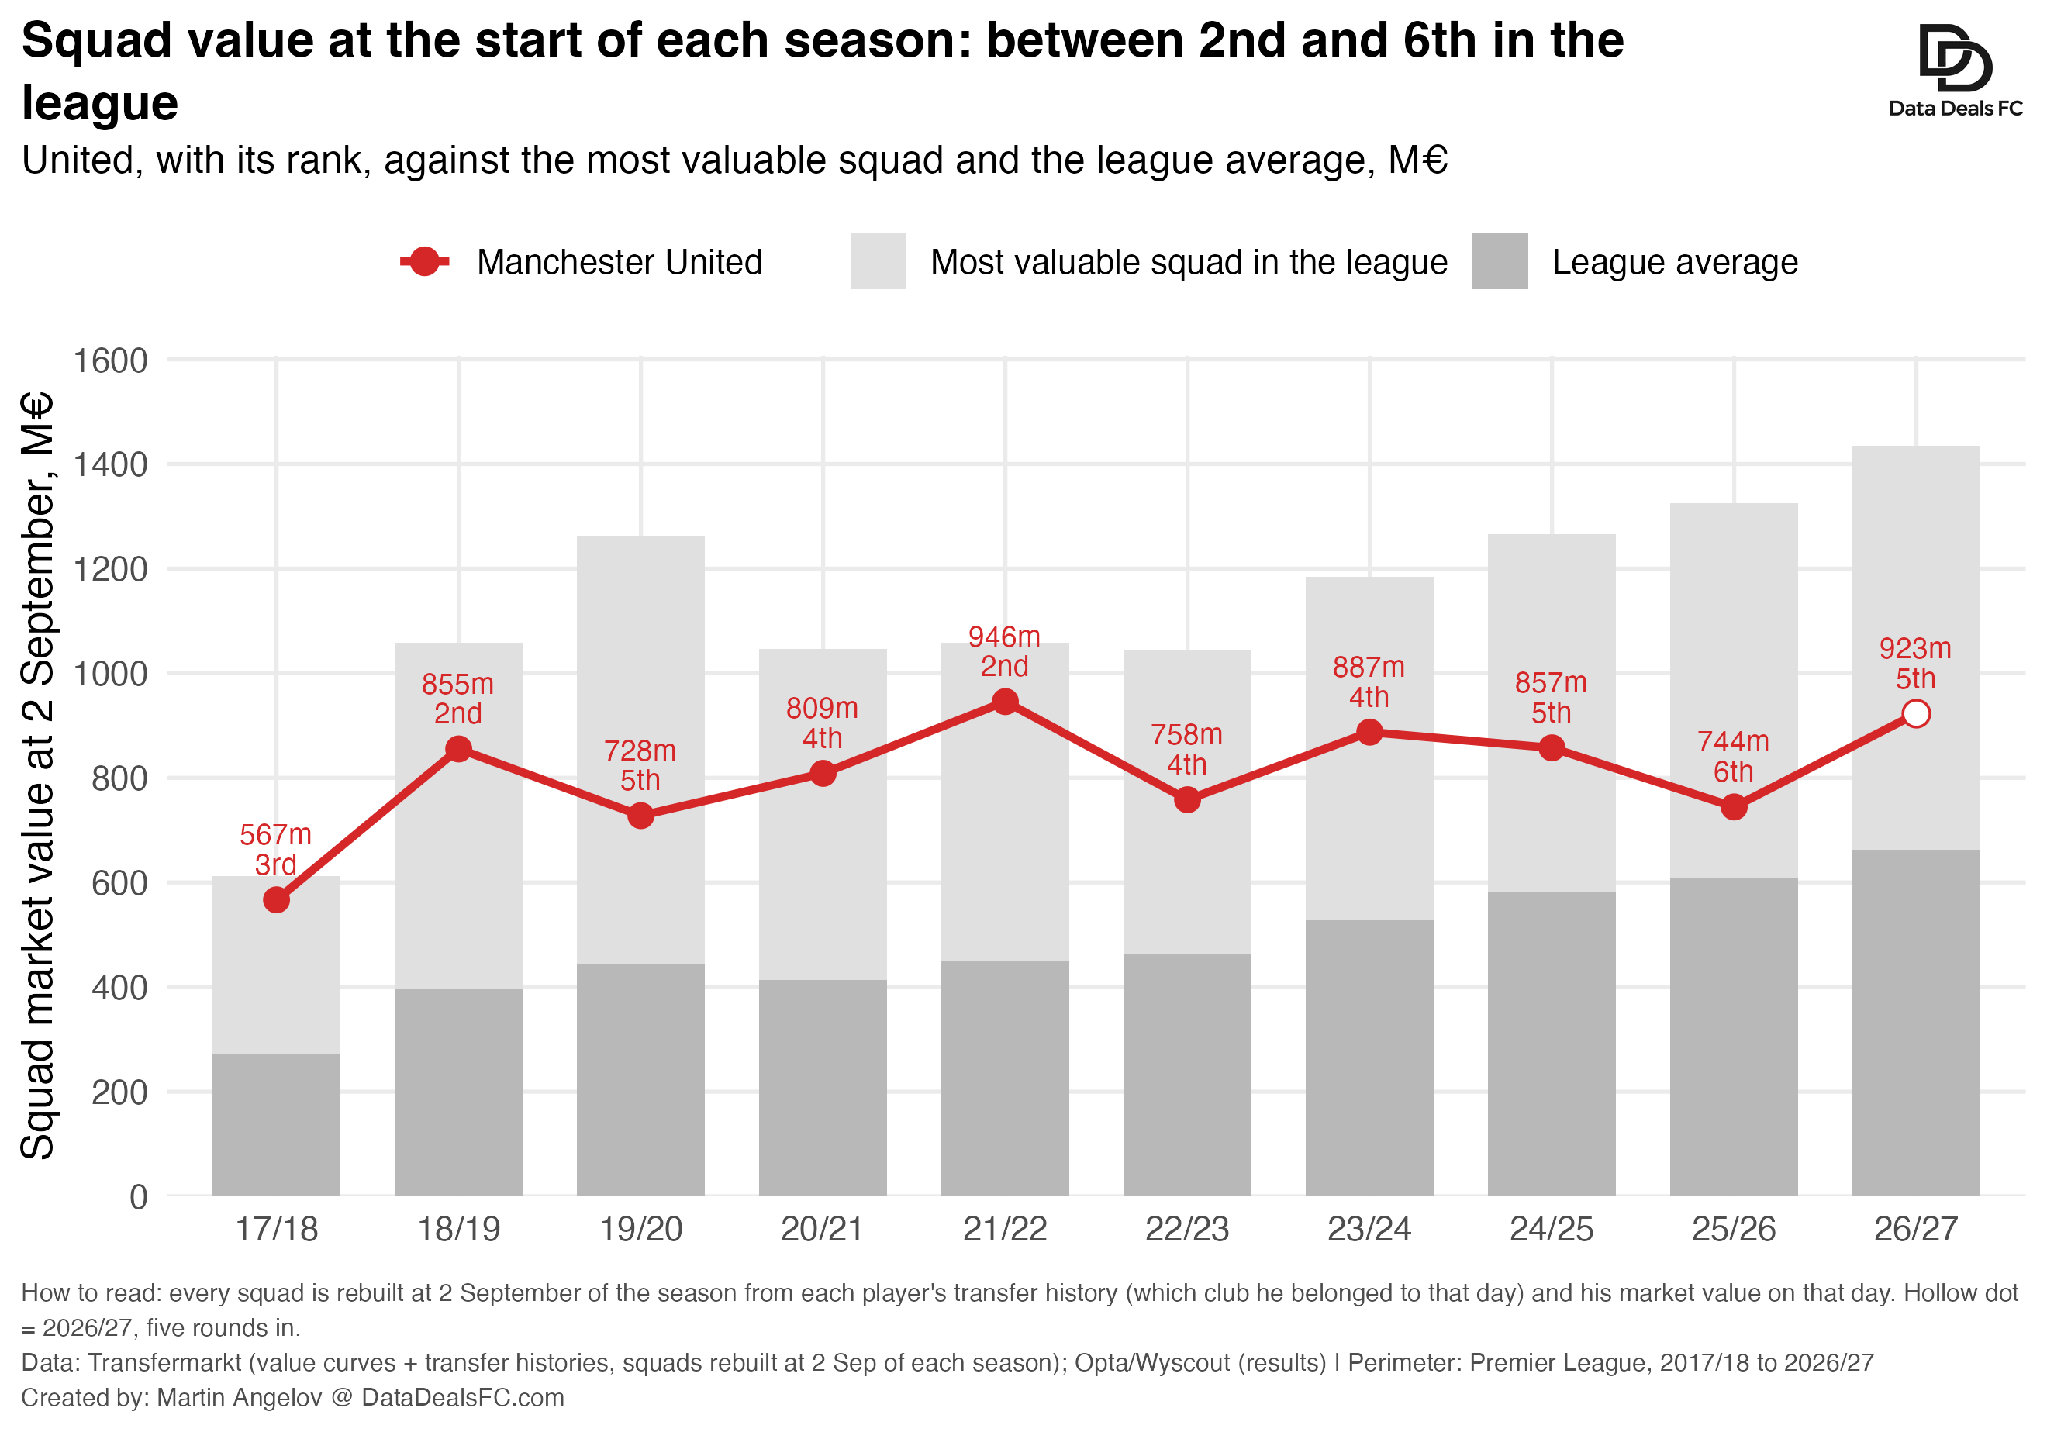
Squad value tells the same story. United fielded one of the six most valuable squads in every season, yet fell below the value line in five of nine. Relative to the league, its squad slid from 2.1 times the average value in 2017/18 to 1.4 times today, because other clubs grew faster.
Because the two measures agree, the explanation is unlikely to be that United’s players were overpaid for their value, or overvalued for their wages. However the squad is priced, it delivered less than squads of that price usually do. The shortfall recurs under different coaches and rebuilt squads, which makes bad luck an unlikely explanation and points instead to how the money was used.
2. Where did the performance fall short?
The obvious suspect is the attack.
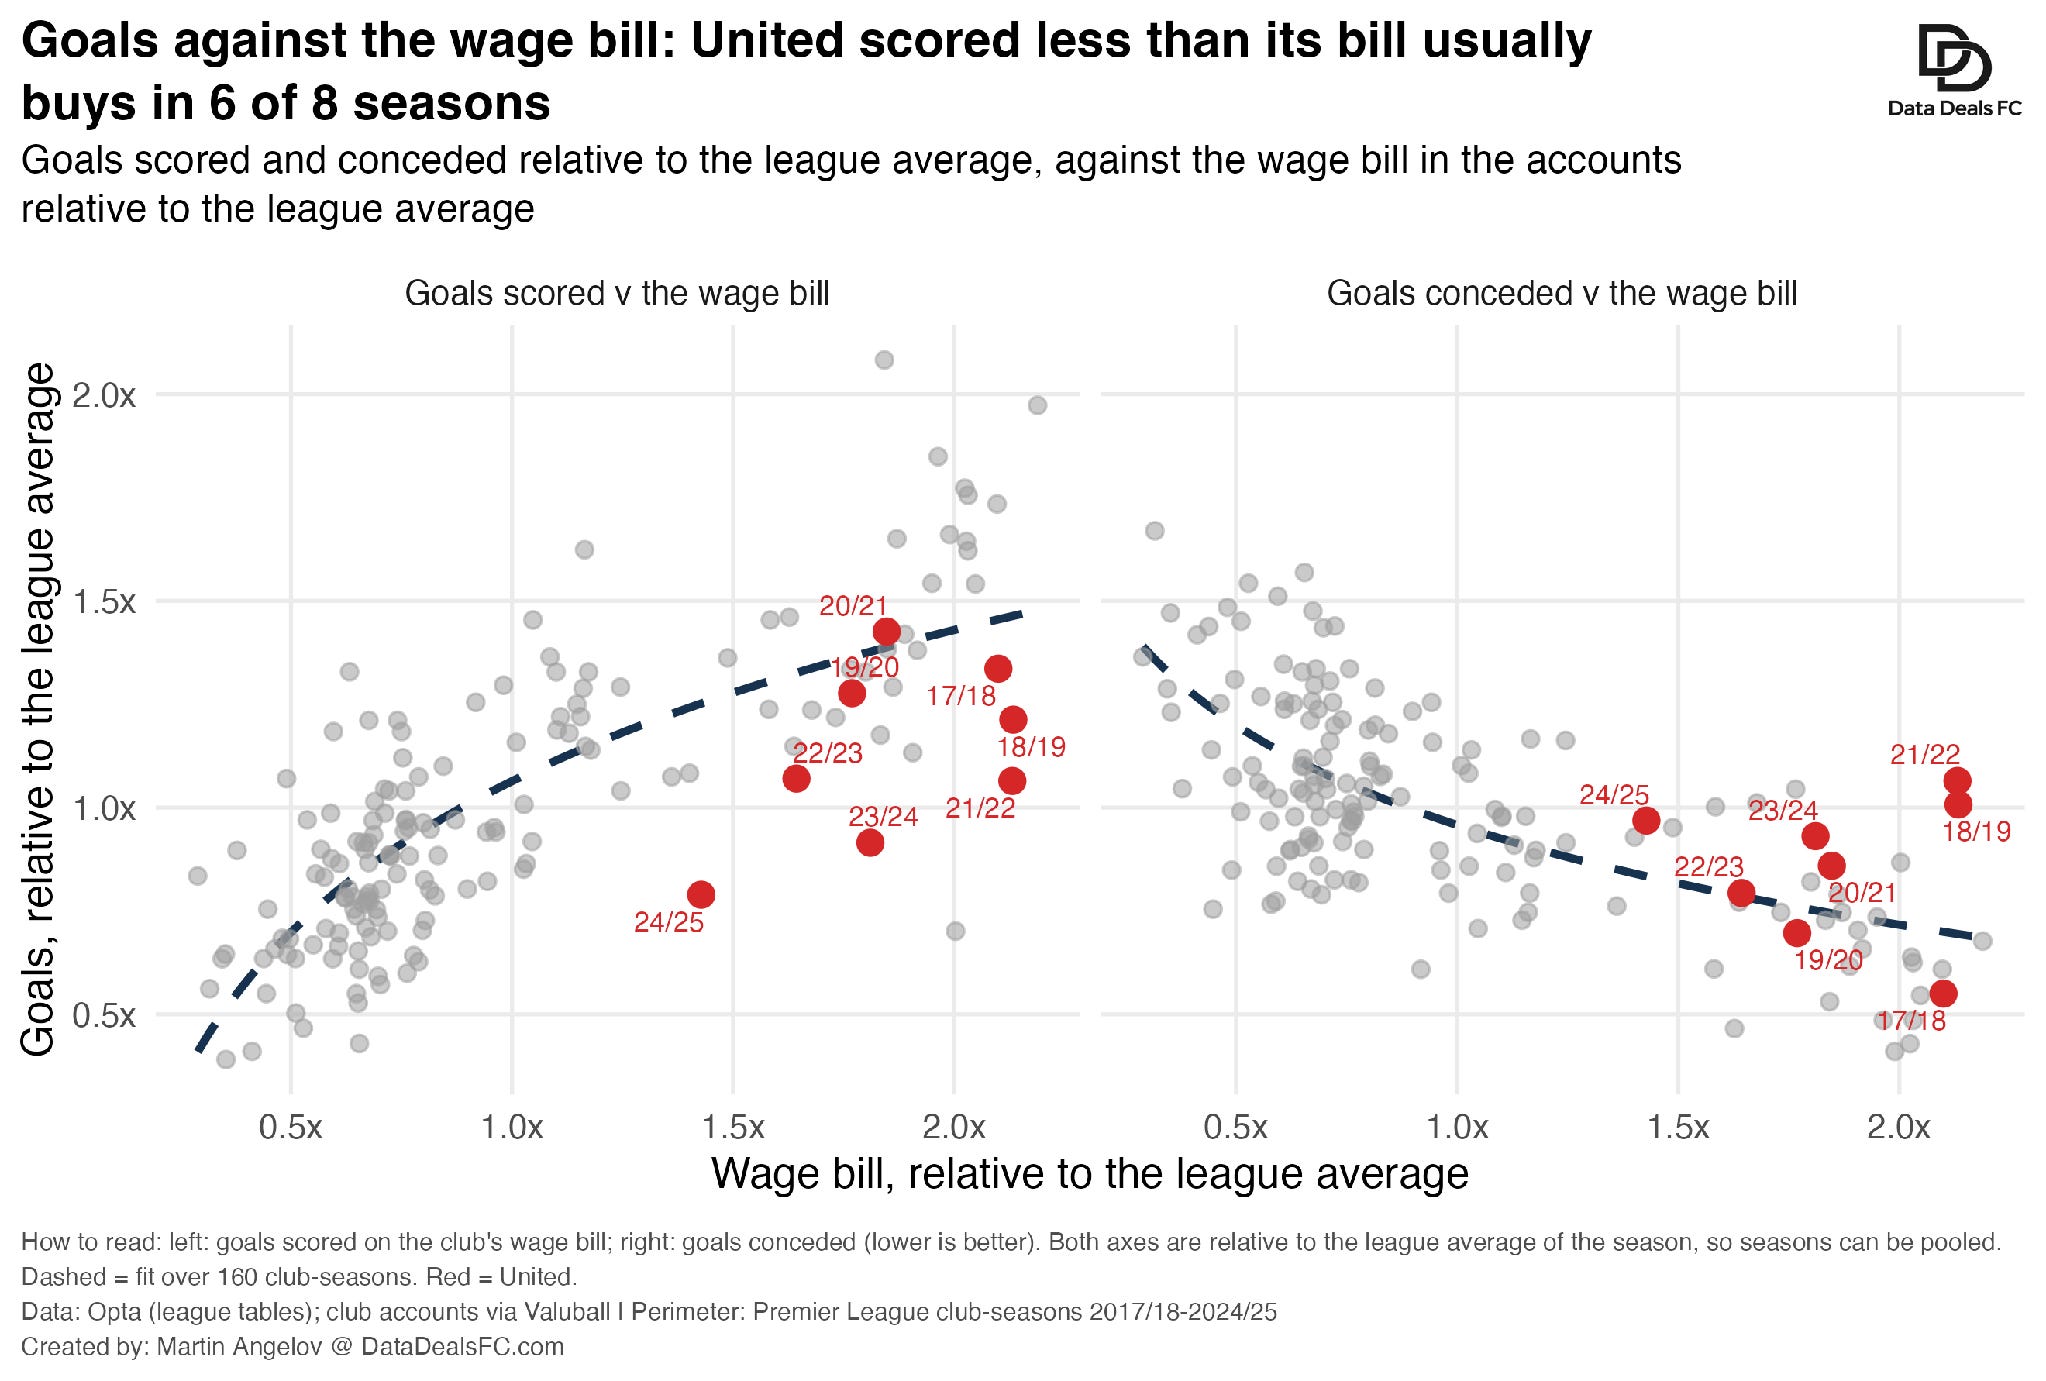
Setting each club’s goals against the market value of the players who produced them, United’s front line scored about 22 goals fewer than attacks of its value usually score in 2023/24, and 23 fewer in 2024/25. The defence, by contrast, has conceded about what a defence of its value suggests since 2022/23.
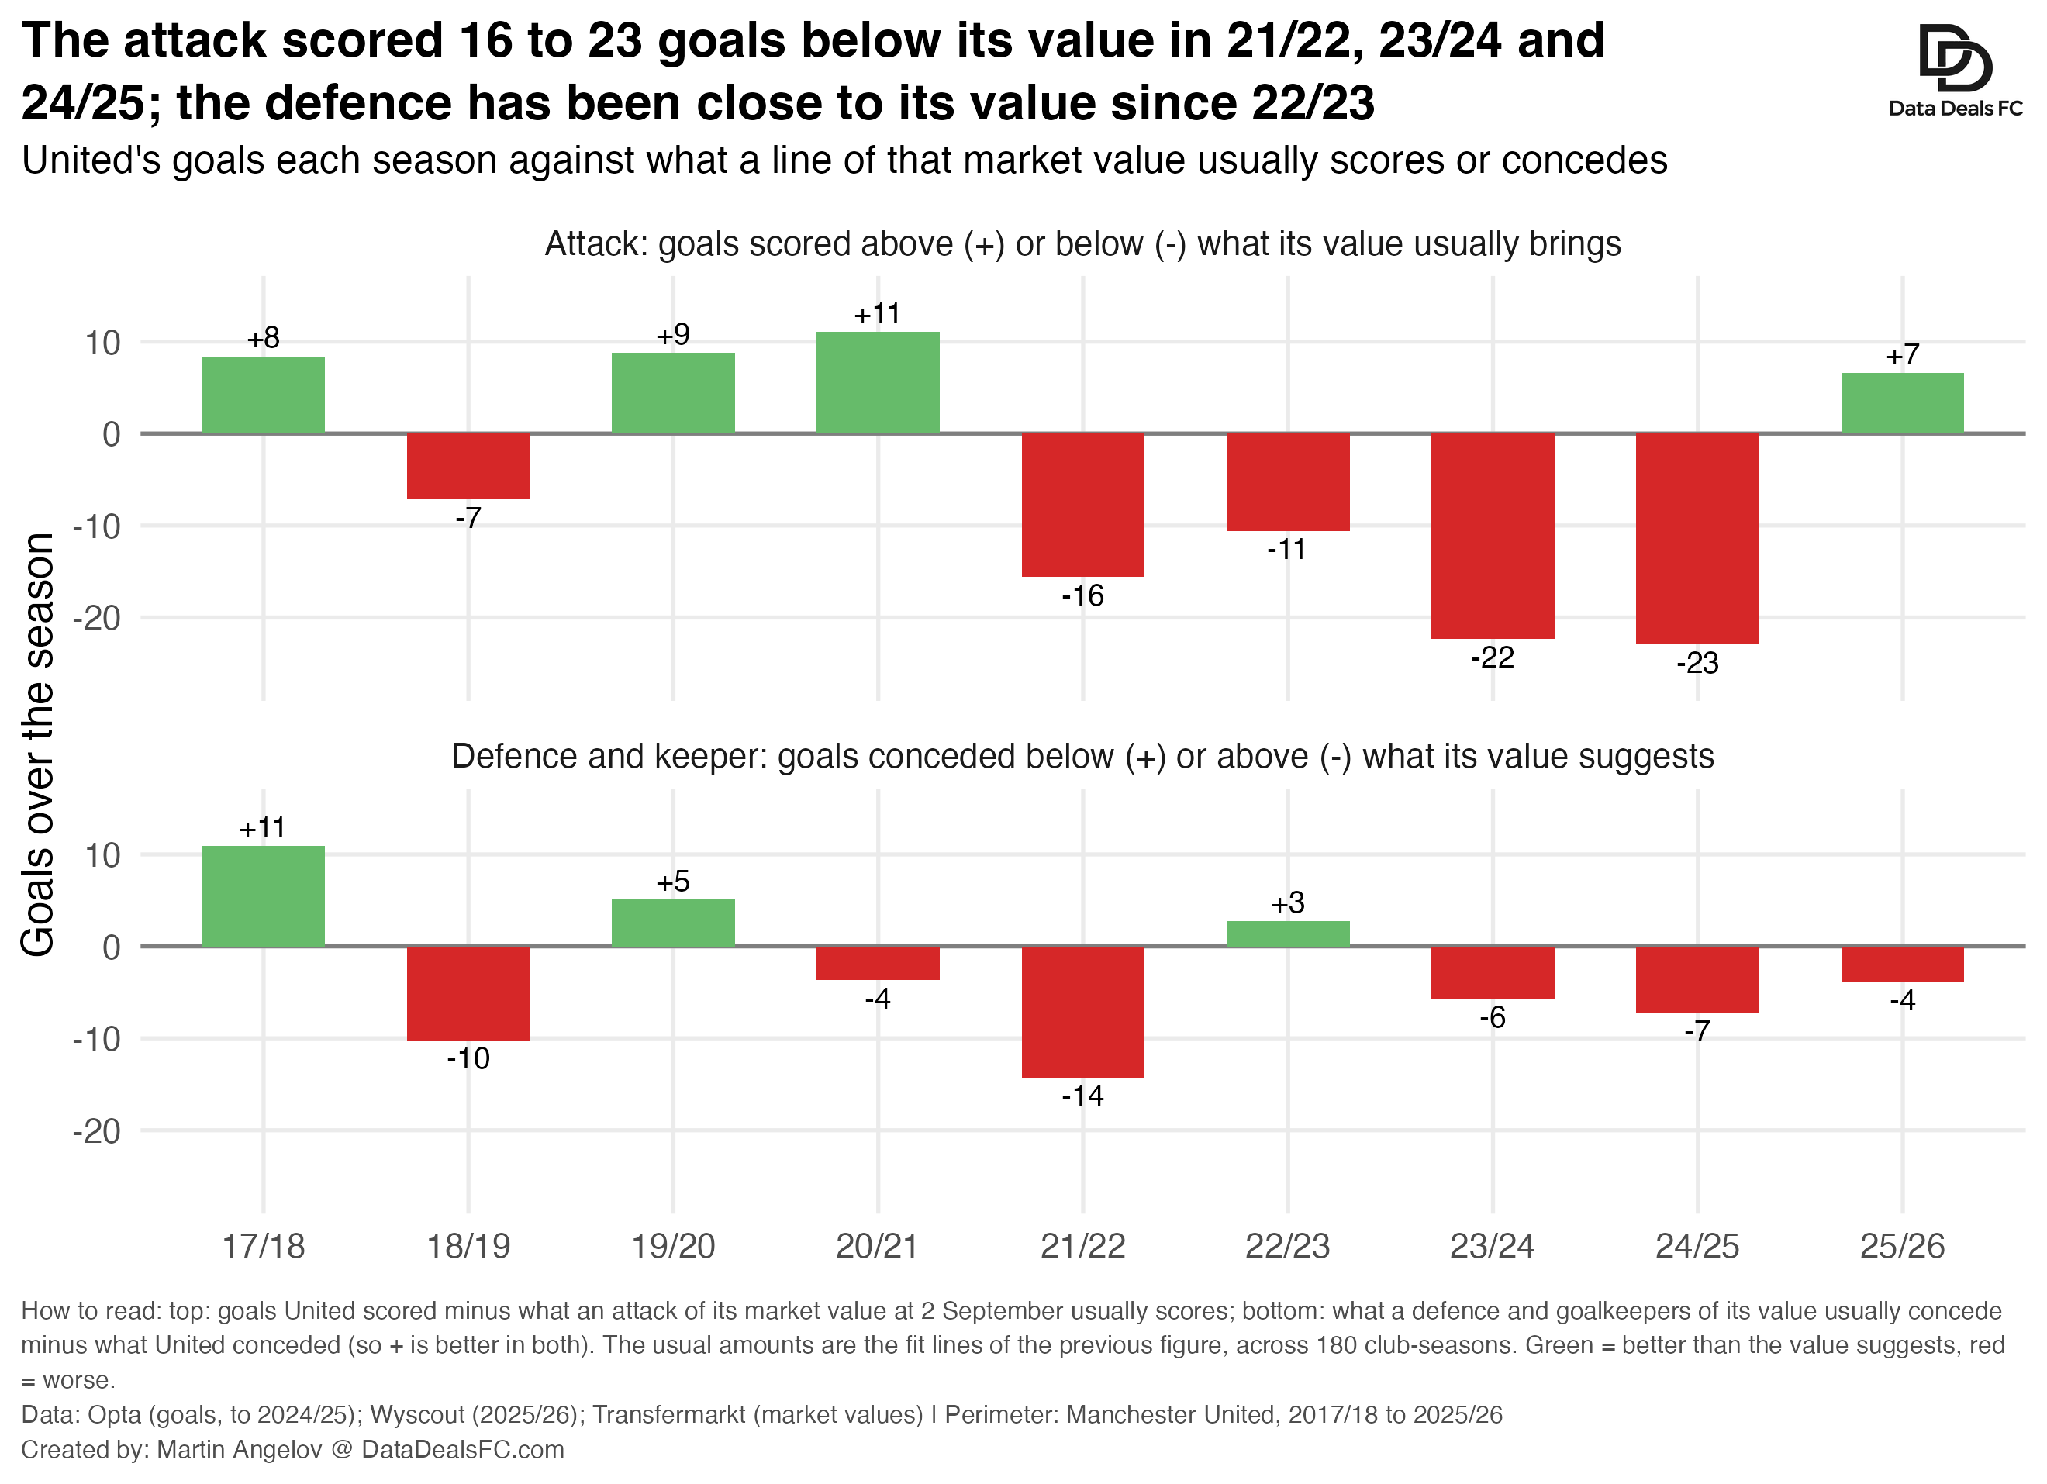
It looks like a finishing problem. It was not.
Was the shortfall in the chances or in the finishing?
In the chances. United made fewer chances, created minus conceded, than its wage bill usually buys in all eight seasons with published accounts. The worst was 2023/24: 1.09 expected goals per game short of the line, about 41 over a season. 2025/26 was the first season of the period on the line.
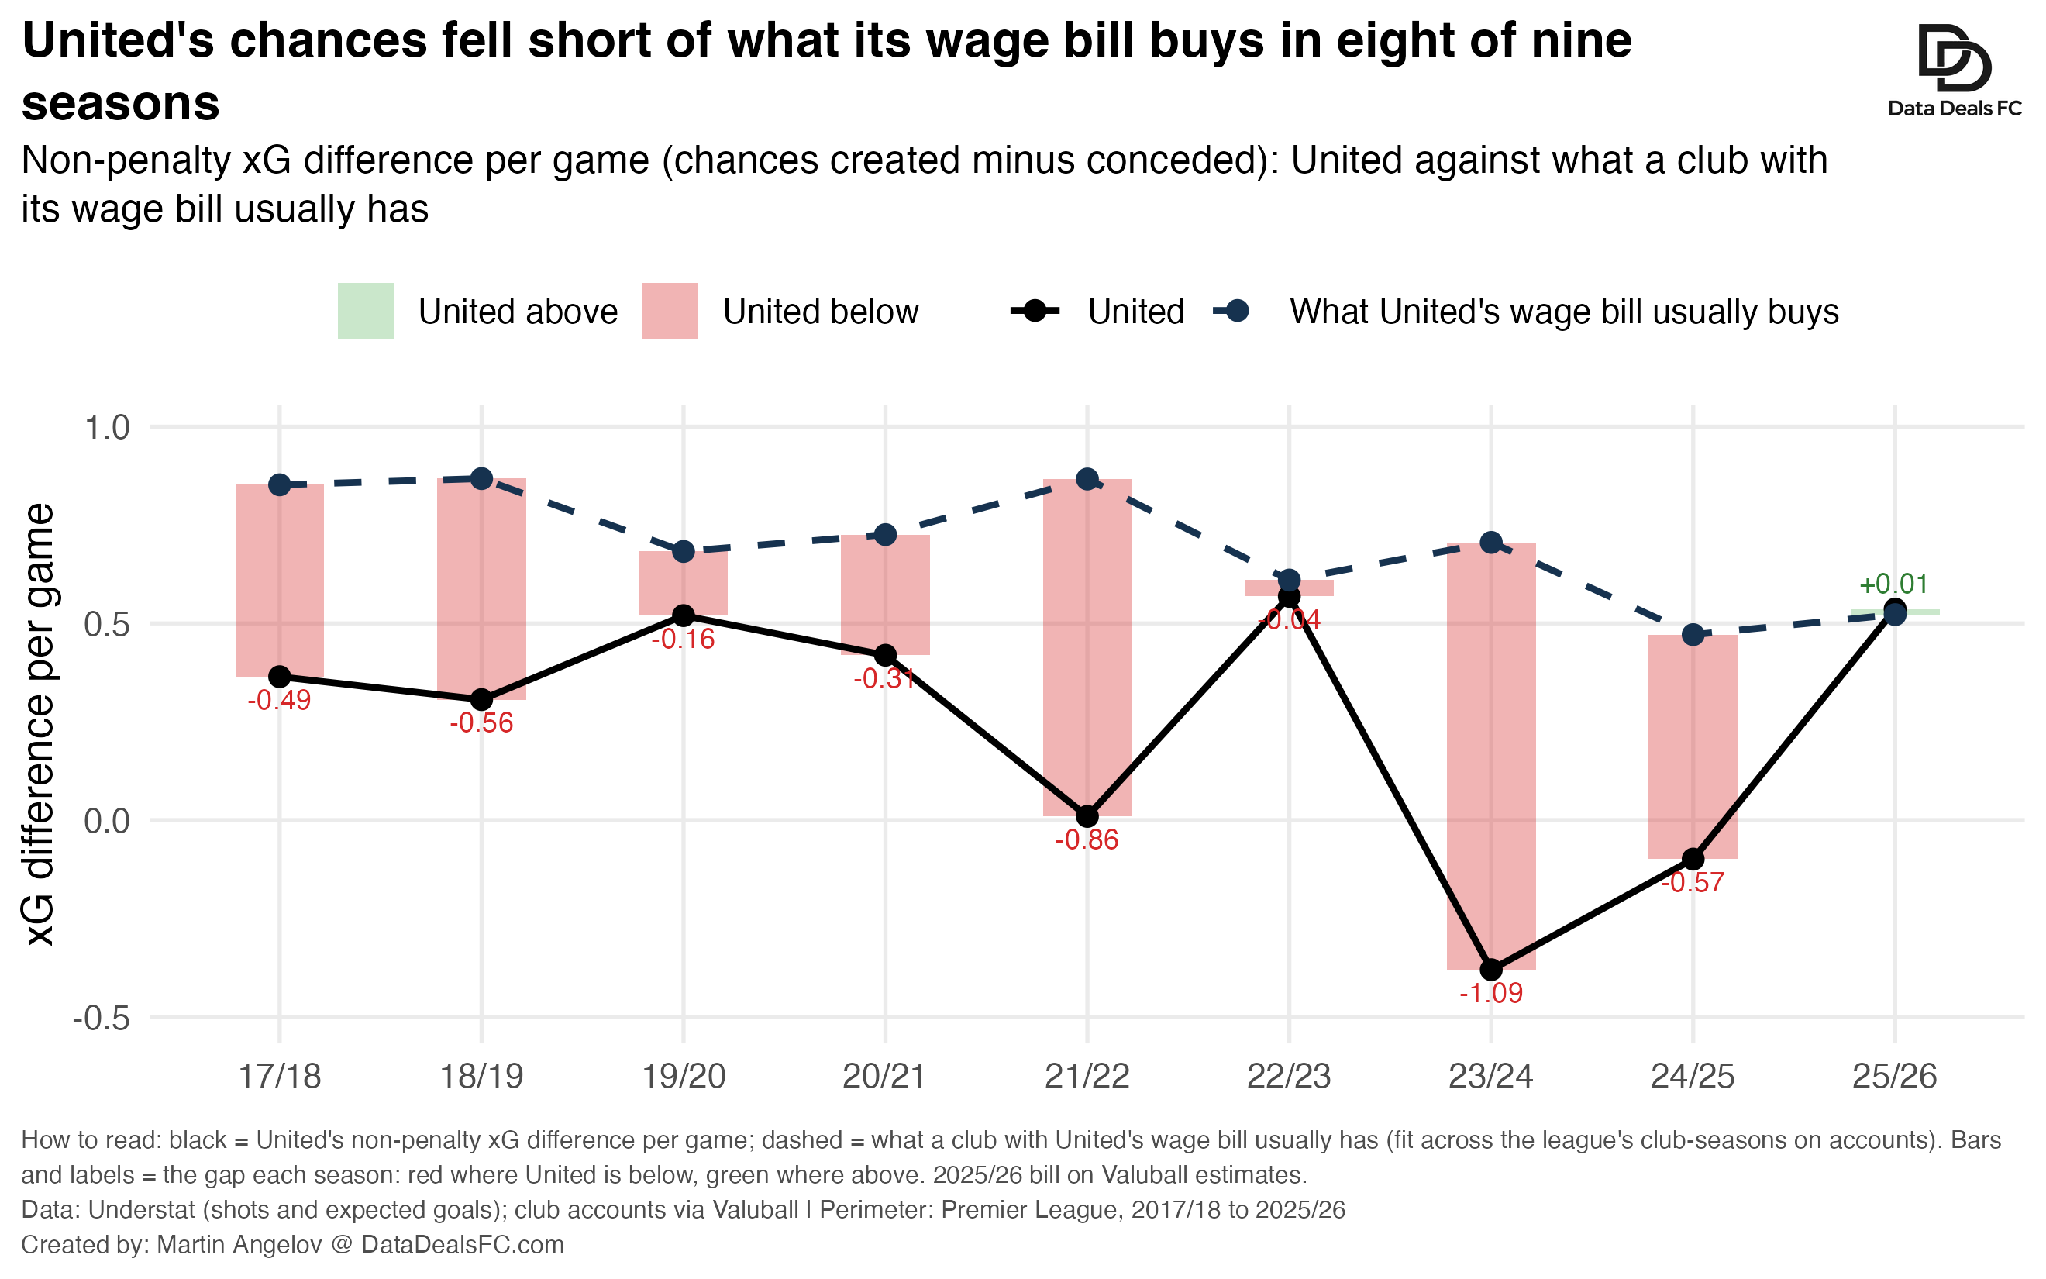
The attackers finished what they did make at about par: 25 non-penalty goals from 28 expected in 2023/24, and 25 from 25 in 2024/25. They were not wasting chances. They were not making enough of them.
If anything, United usually got more than its chances deserved. In seven of nine seasons it took more points than those chances usually bring.
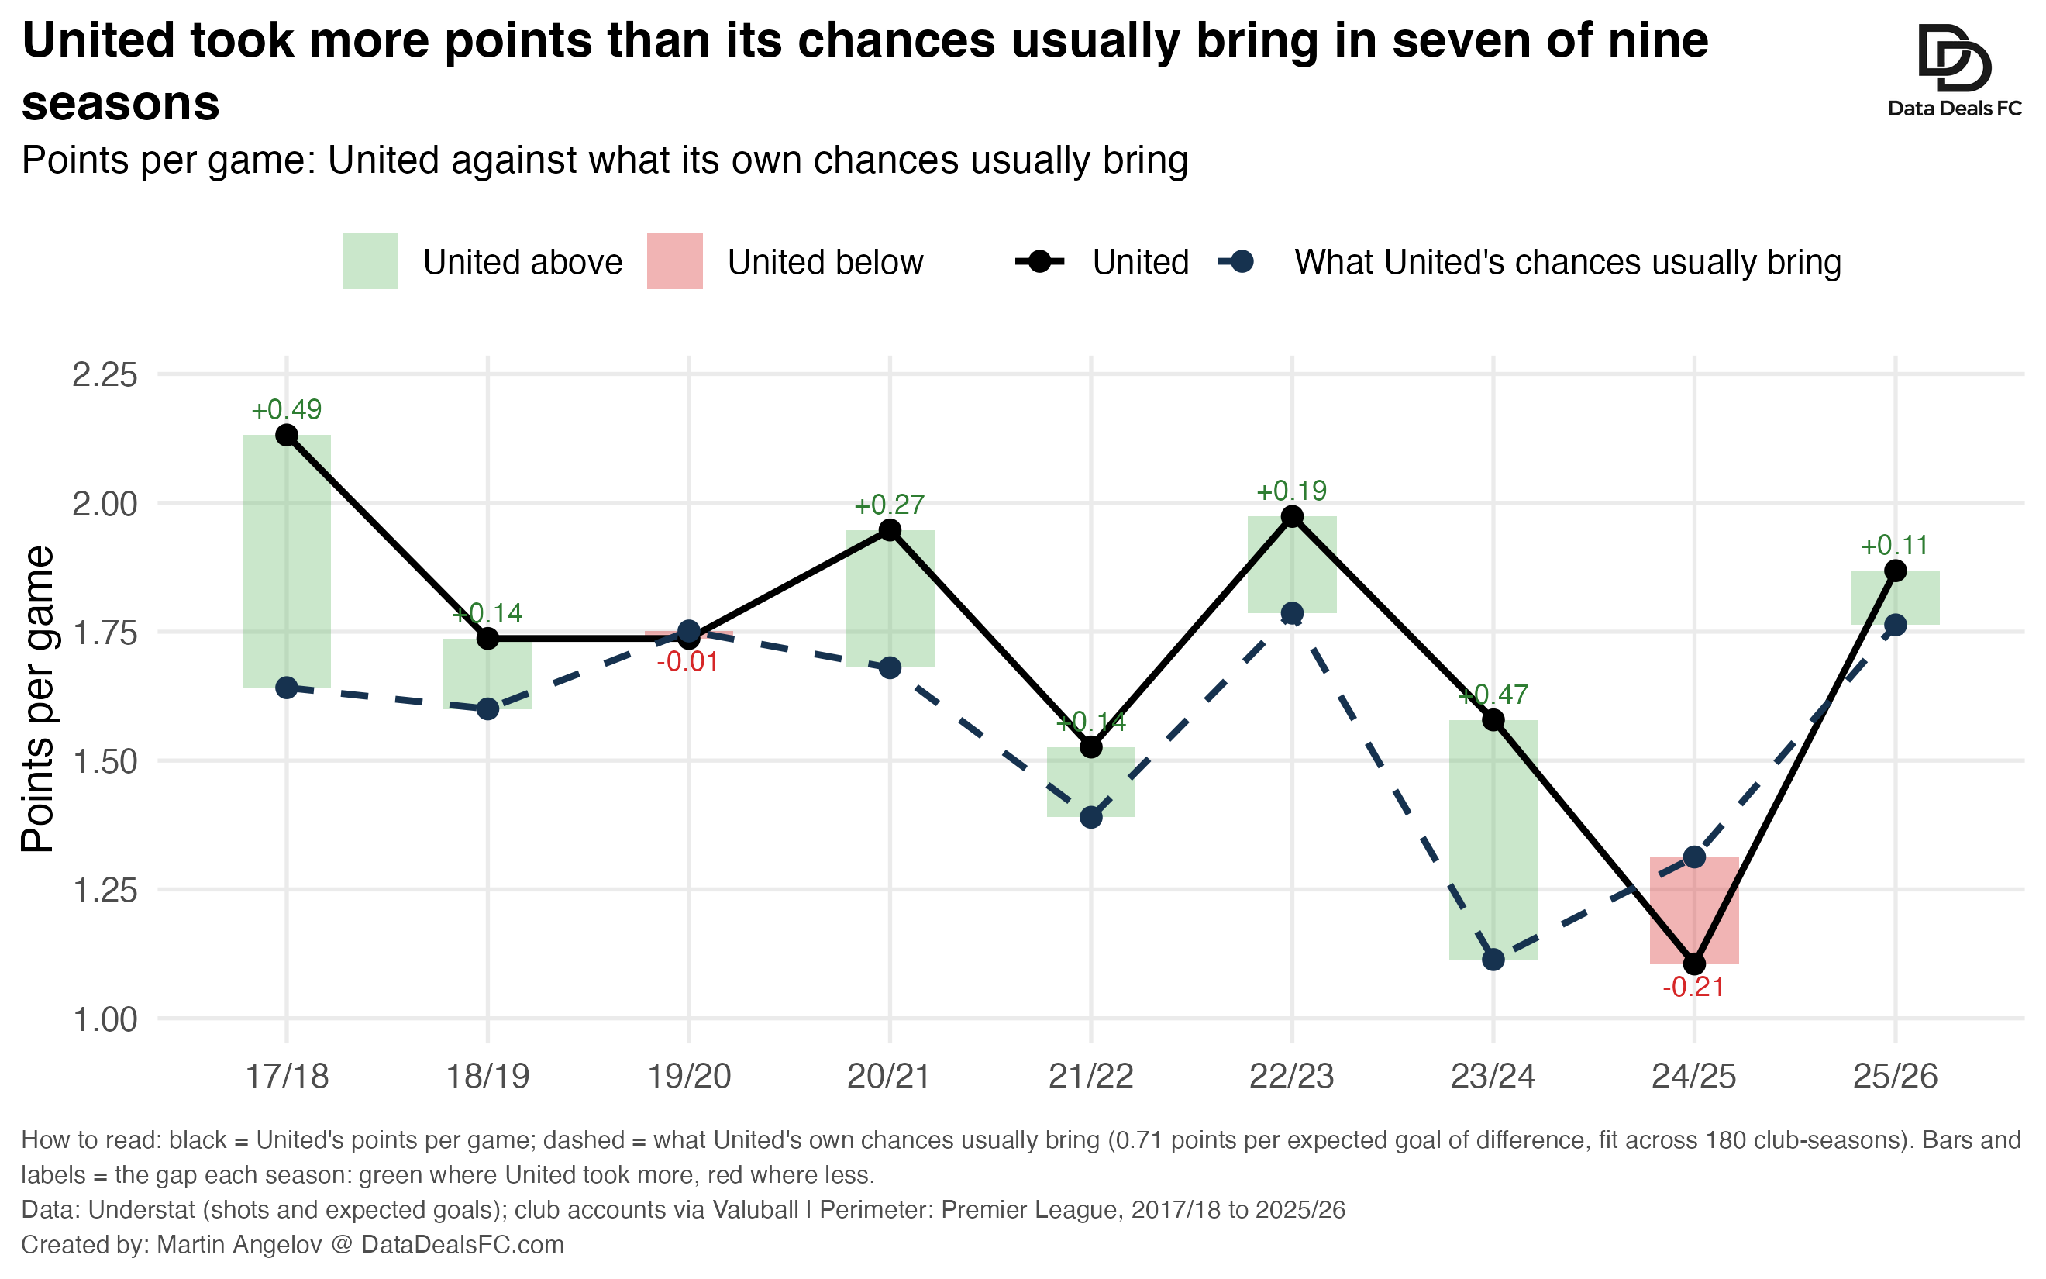
The finishing, the goalkeeping and the margins of close games did not cause the shortfall; they covered for part of it.
How much did luck flatter the table?
To find out, I replayed every match of every season 10,000 times from the shots both teams took, each shot going in with the probability its expected goals give. The idea is simple: keep the chances, re-roll the finishing, and see where the team usually ends up.
In 2017/18 United finished 2nd. Its median replay was 6th, and only 1% of replays reached 2nd or higher (I guess Mourinho was right to claim that finishing second with United that season was “one of the best achievements in his career” after all). The side that finished 8th in 2023/24 had, on its chances, the profile of a 15th-placed team. Over the nine seasons United took about 47 points more than its replays average.
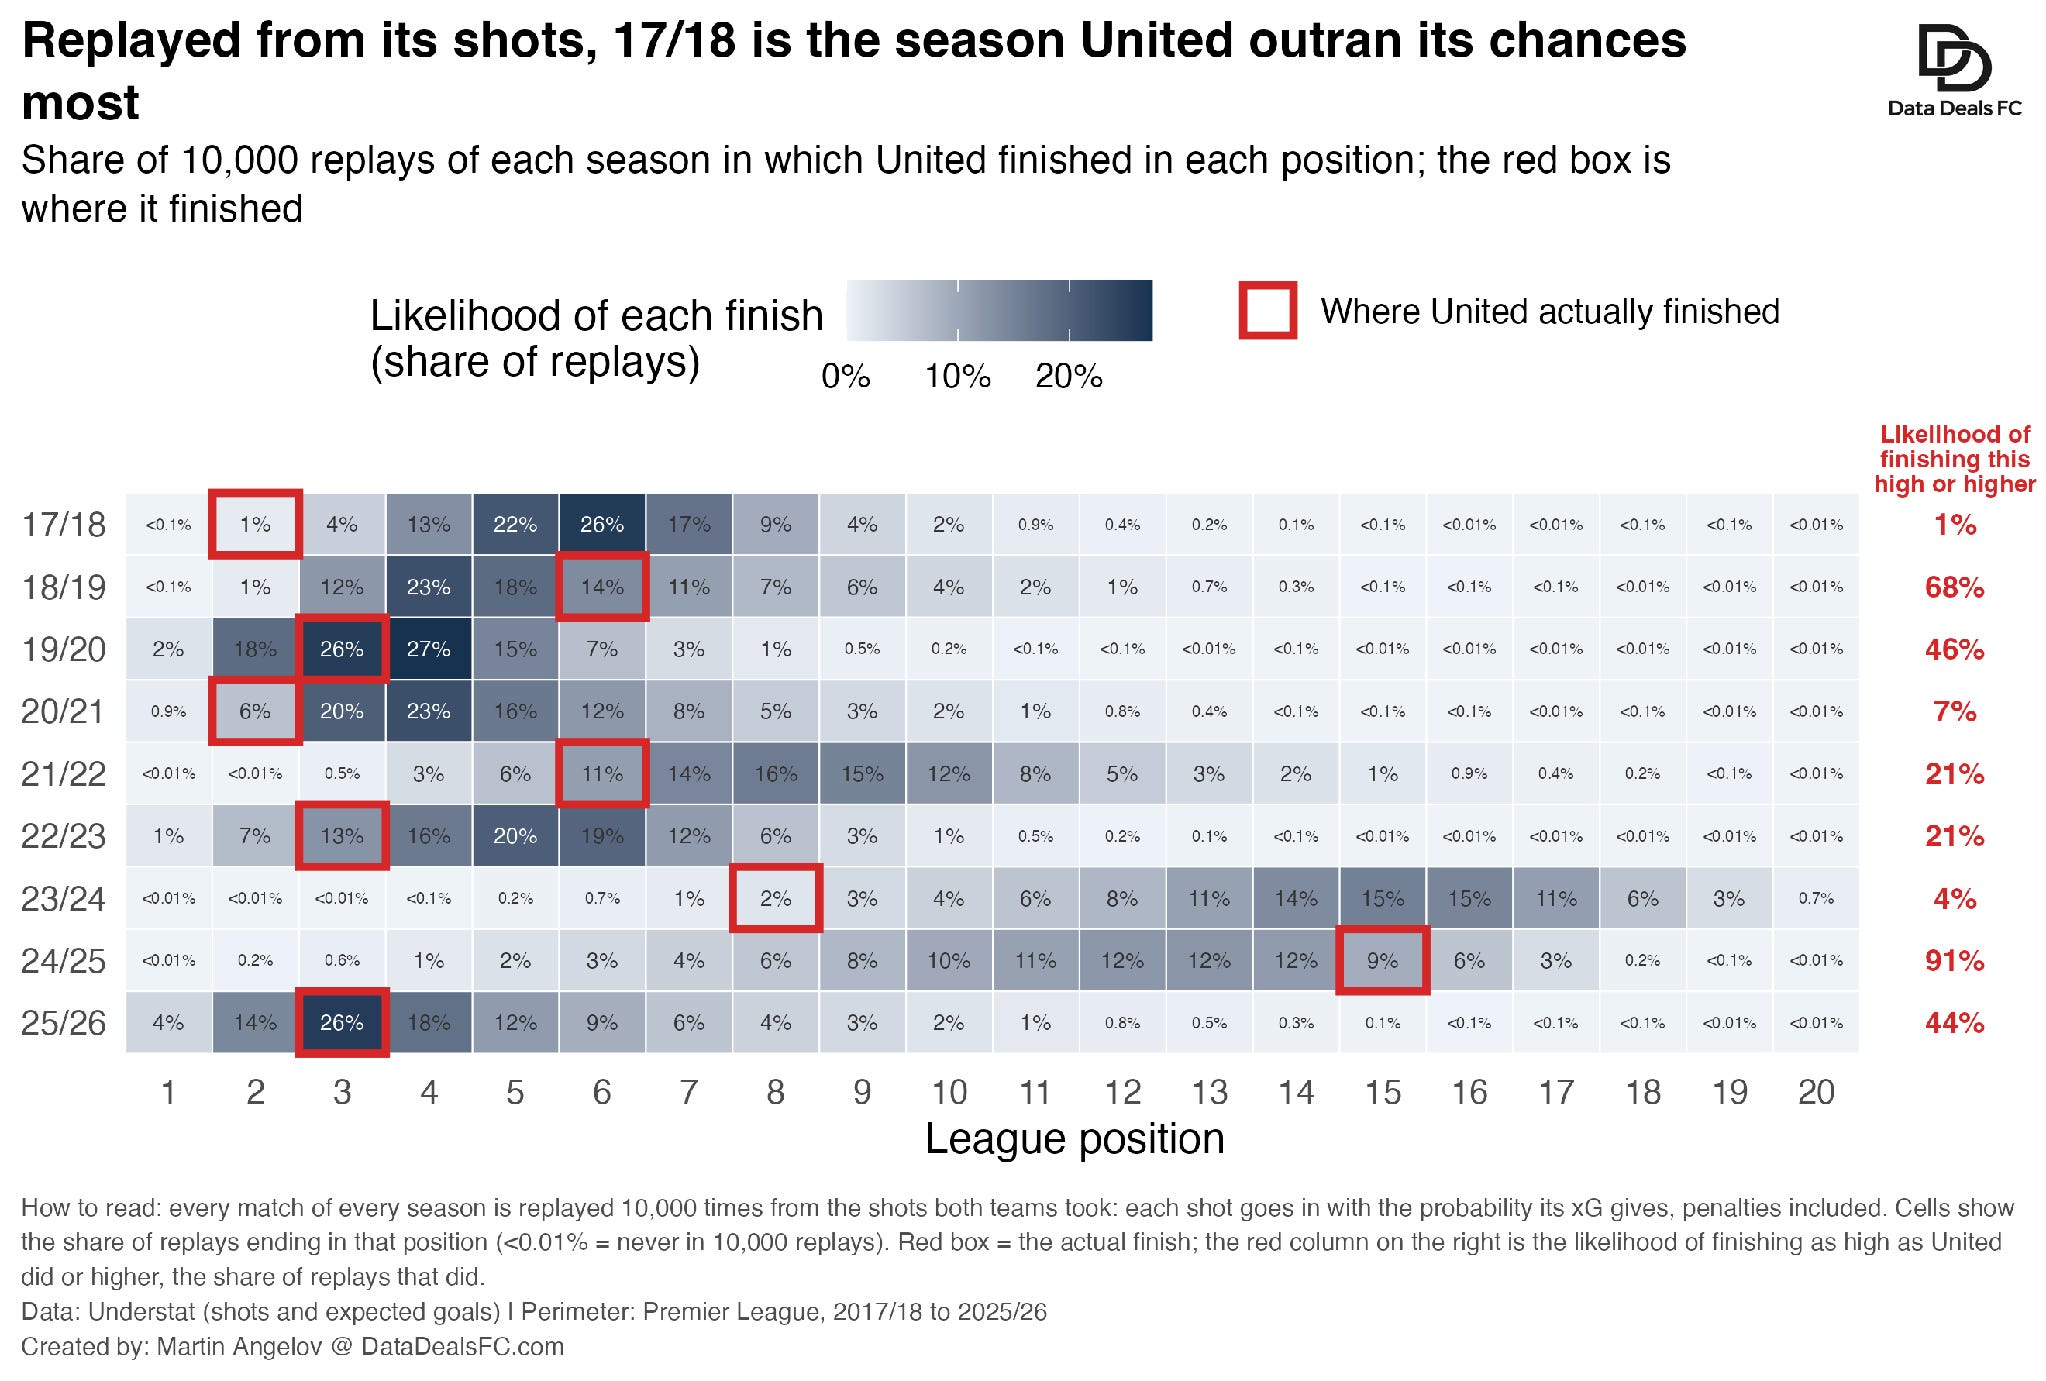
Much of that cushion had a name. In 2017/18 David de Gea prevented 12.5 goals more than an average keeper would have conceded from the shots he faced, the best in the league and worth about eight points. No United keeper since has stood out from what luck alone would produce.
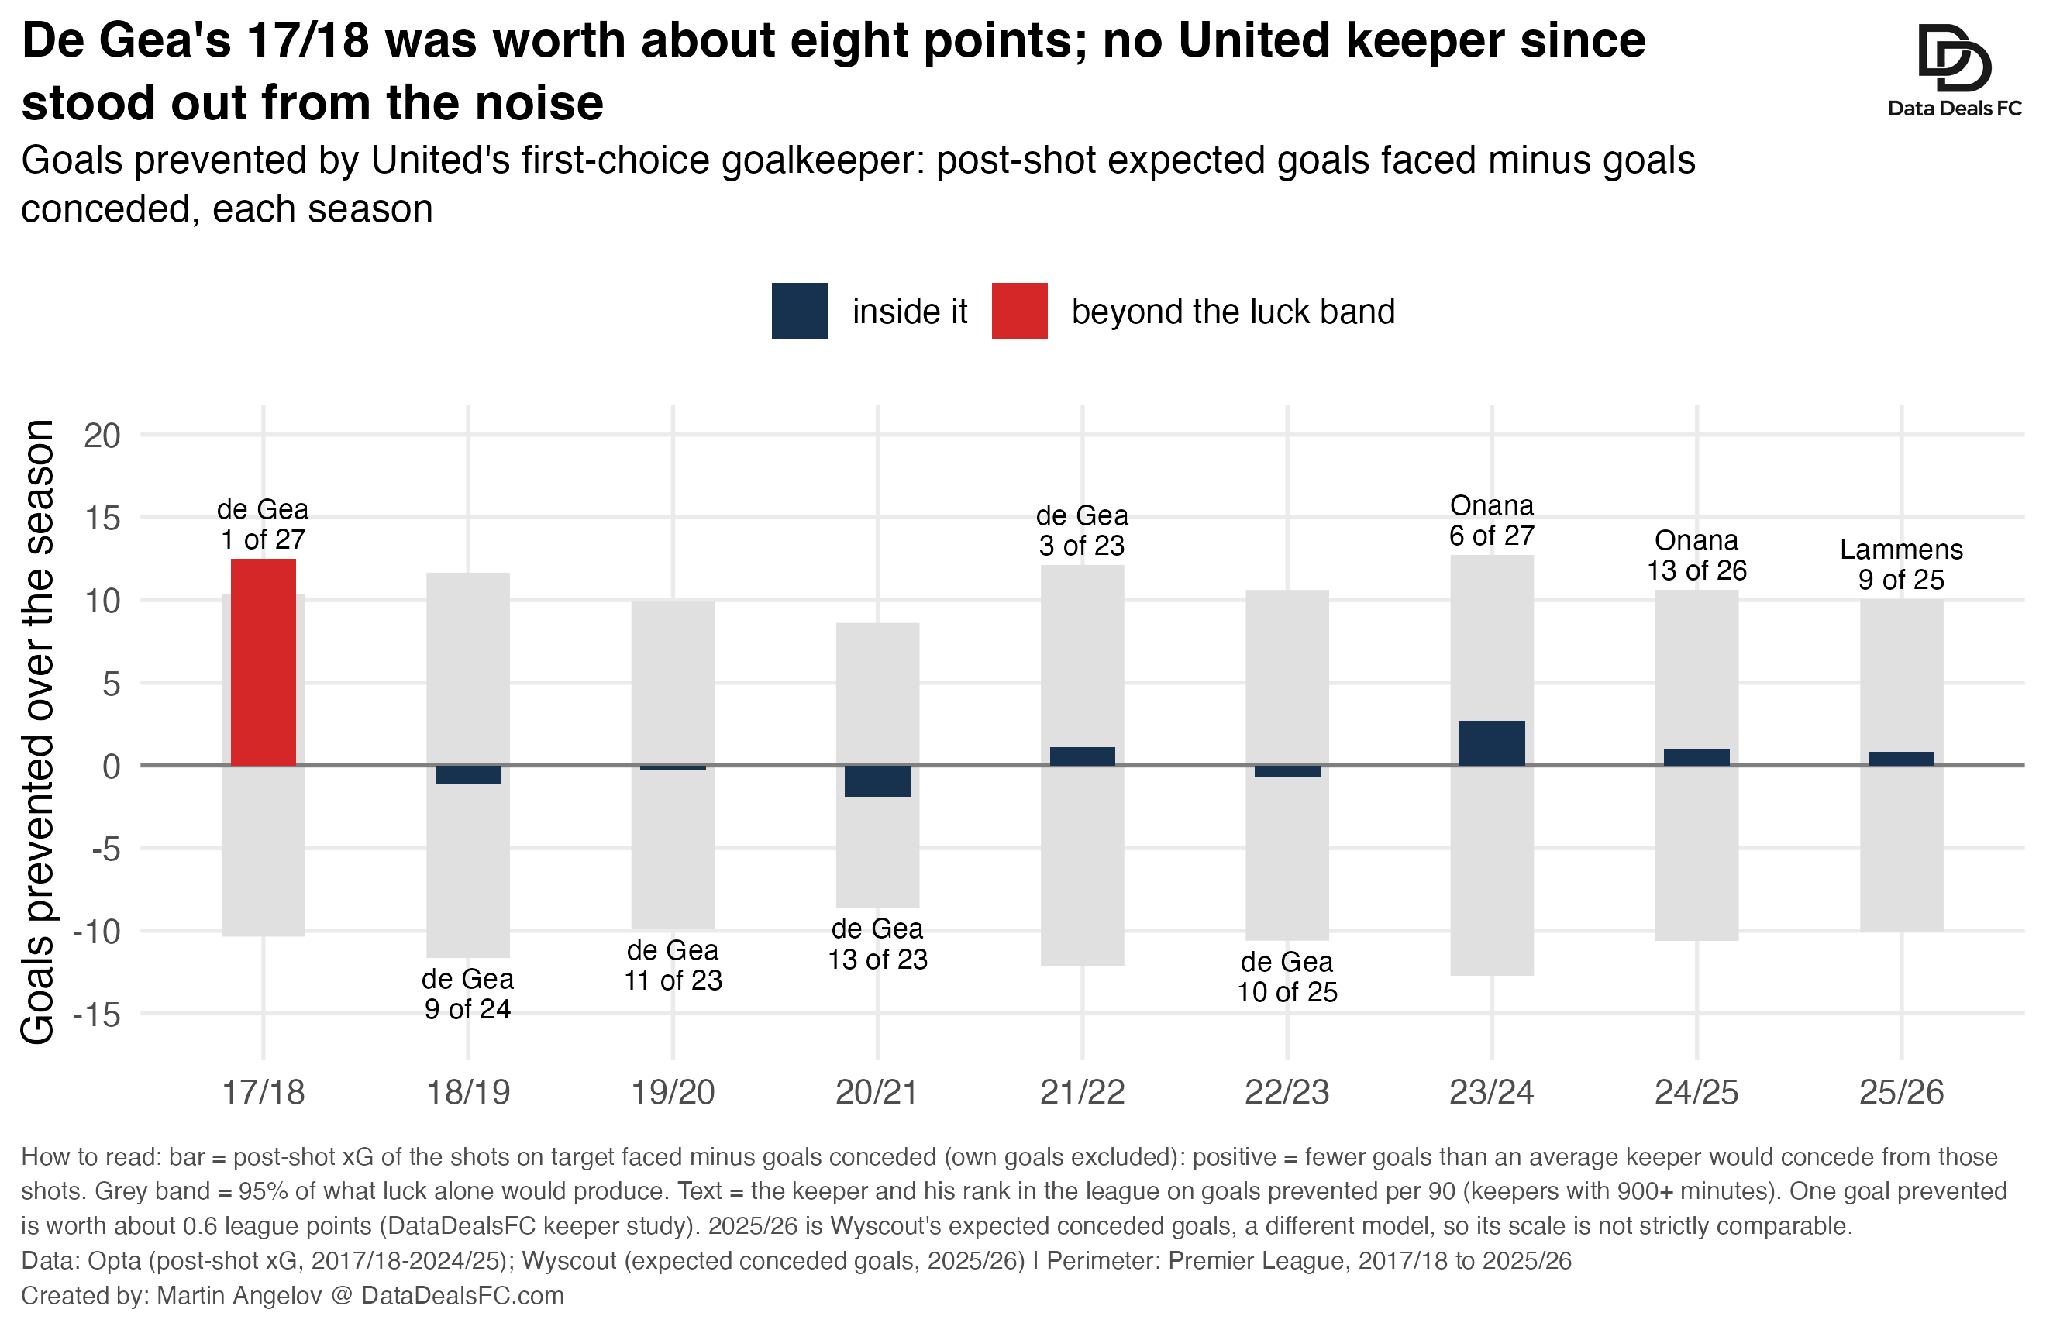
The lesson is uncomfortable for anyone who reads the final rankings table first. In its best seasons the table showed a better team than the chances did. A club that reads its points rather than its chances is likely to have drawn the wrong lessons from those seasons.
Who created the chances that did exist?
Mostly one player. Since 2020/21 Bruno Fernandes has made between a fifth and a third of United’s expected assisted goals in every season, 35% last season. At the median club, the top creator makes 16% to 20%.
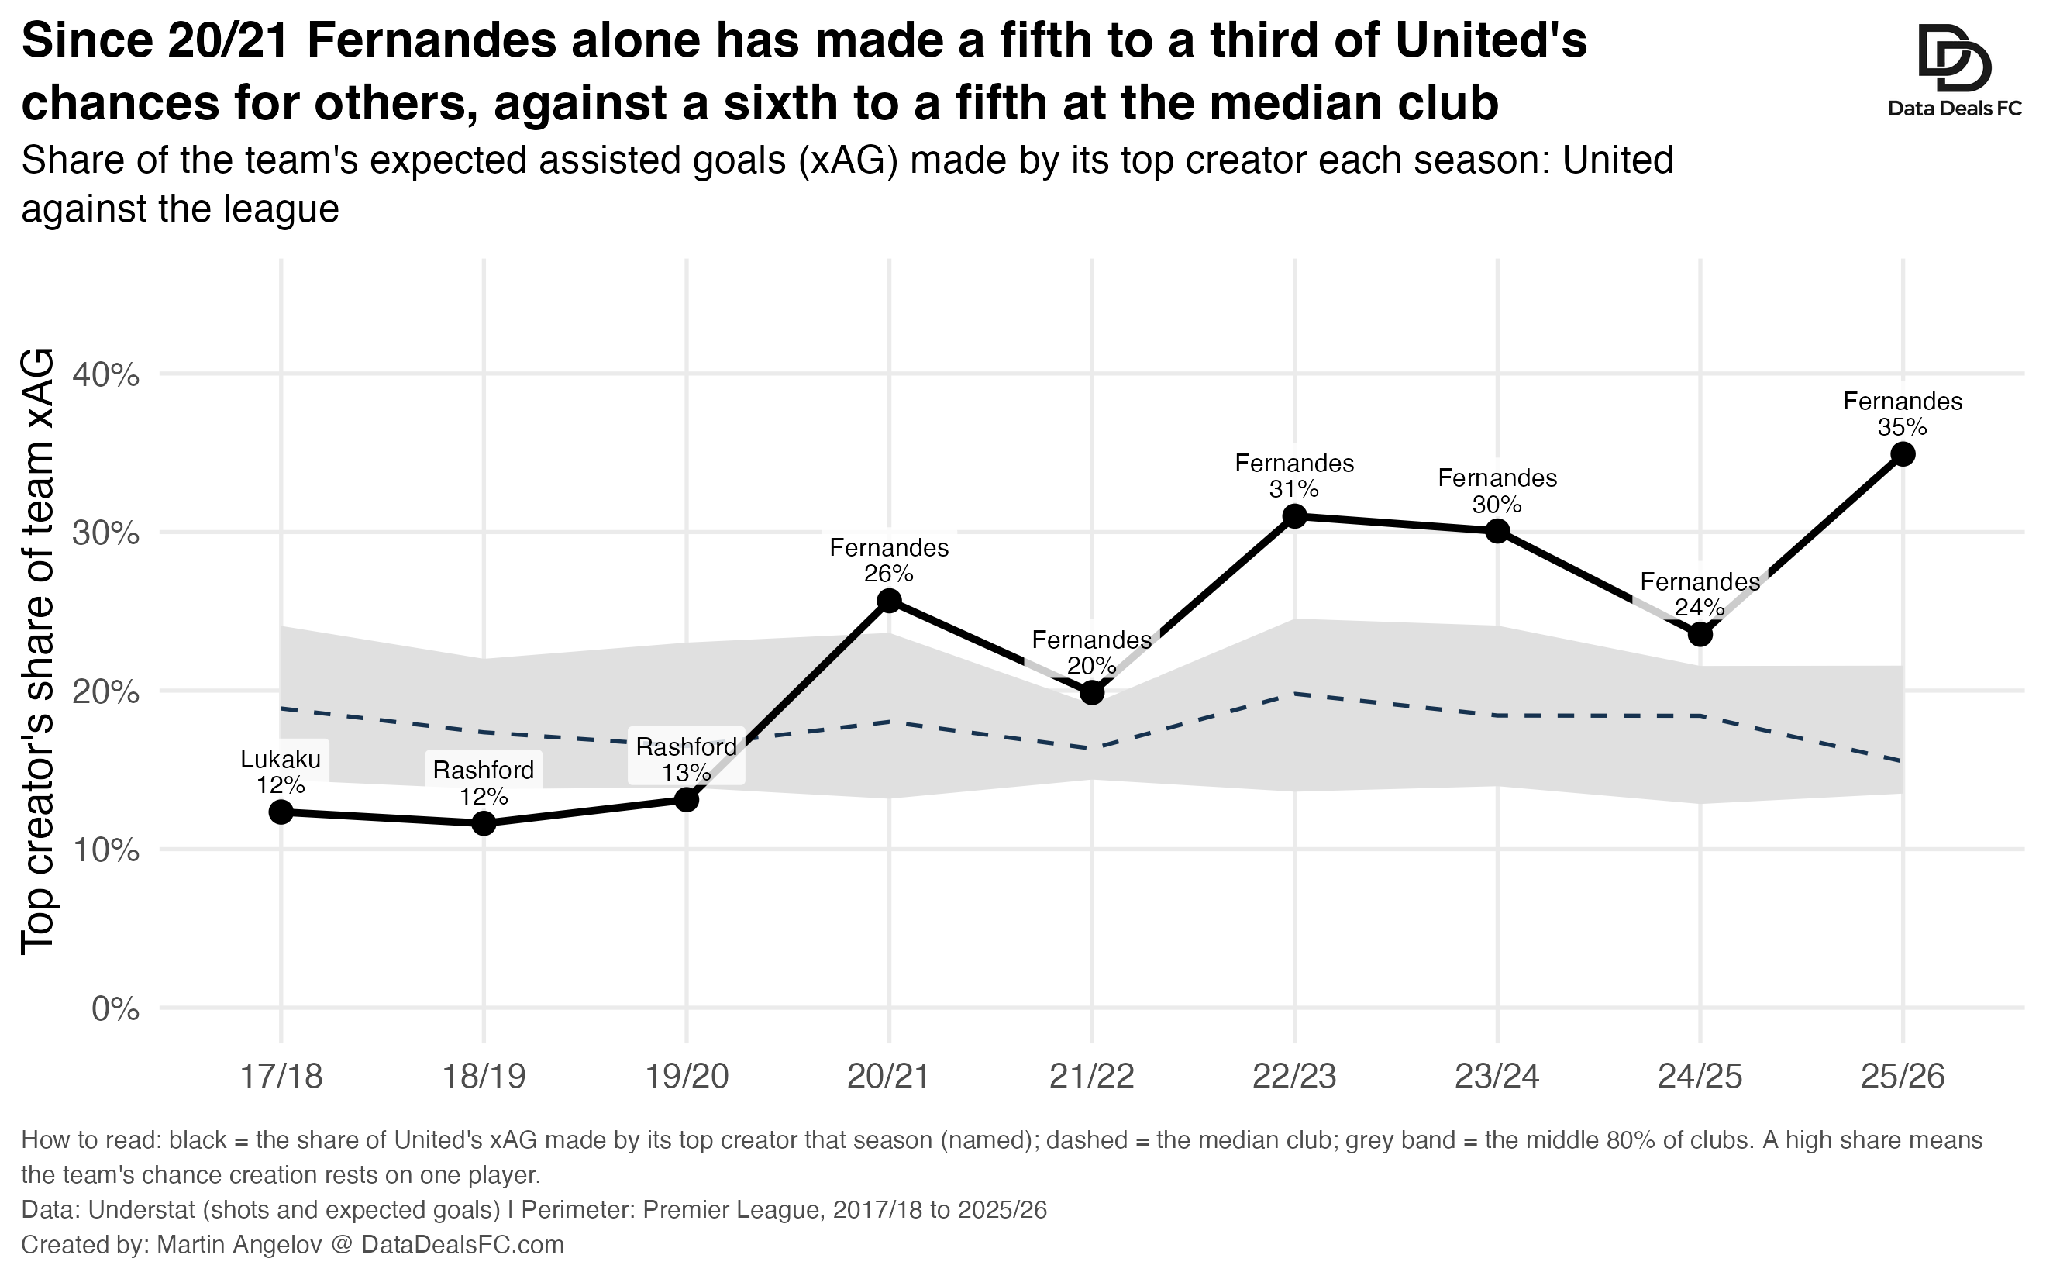
A team that creates through one player has little to fall back on. That dependence is also the other side of the captain’s value, and one reason his contract, which ends in June 2027, carries so much weight.
How much did injuries take?
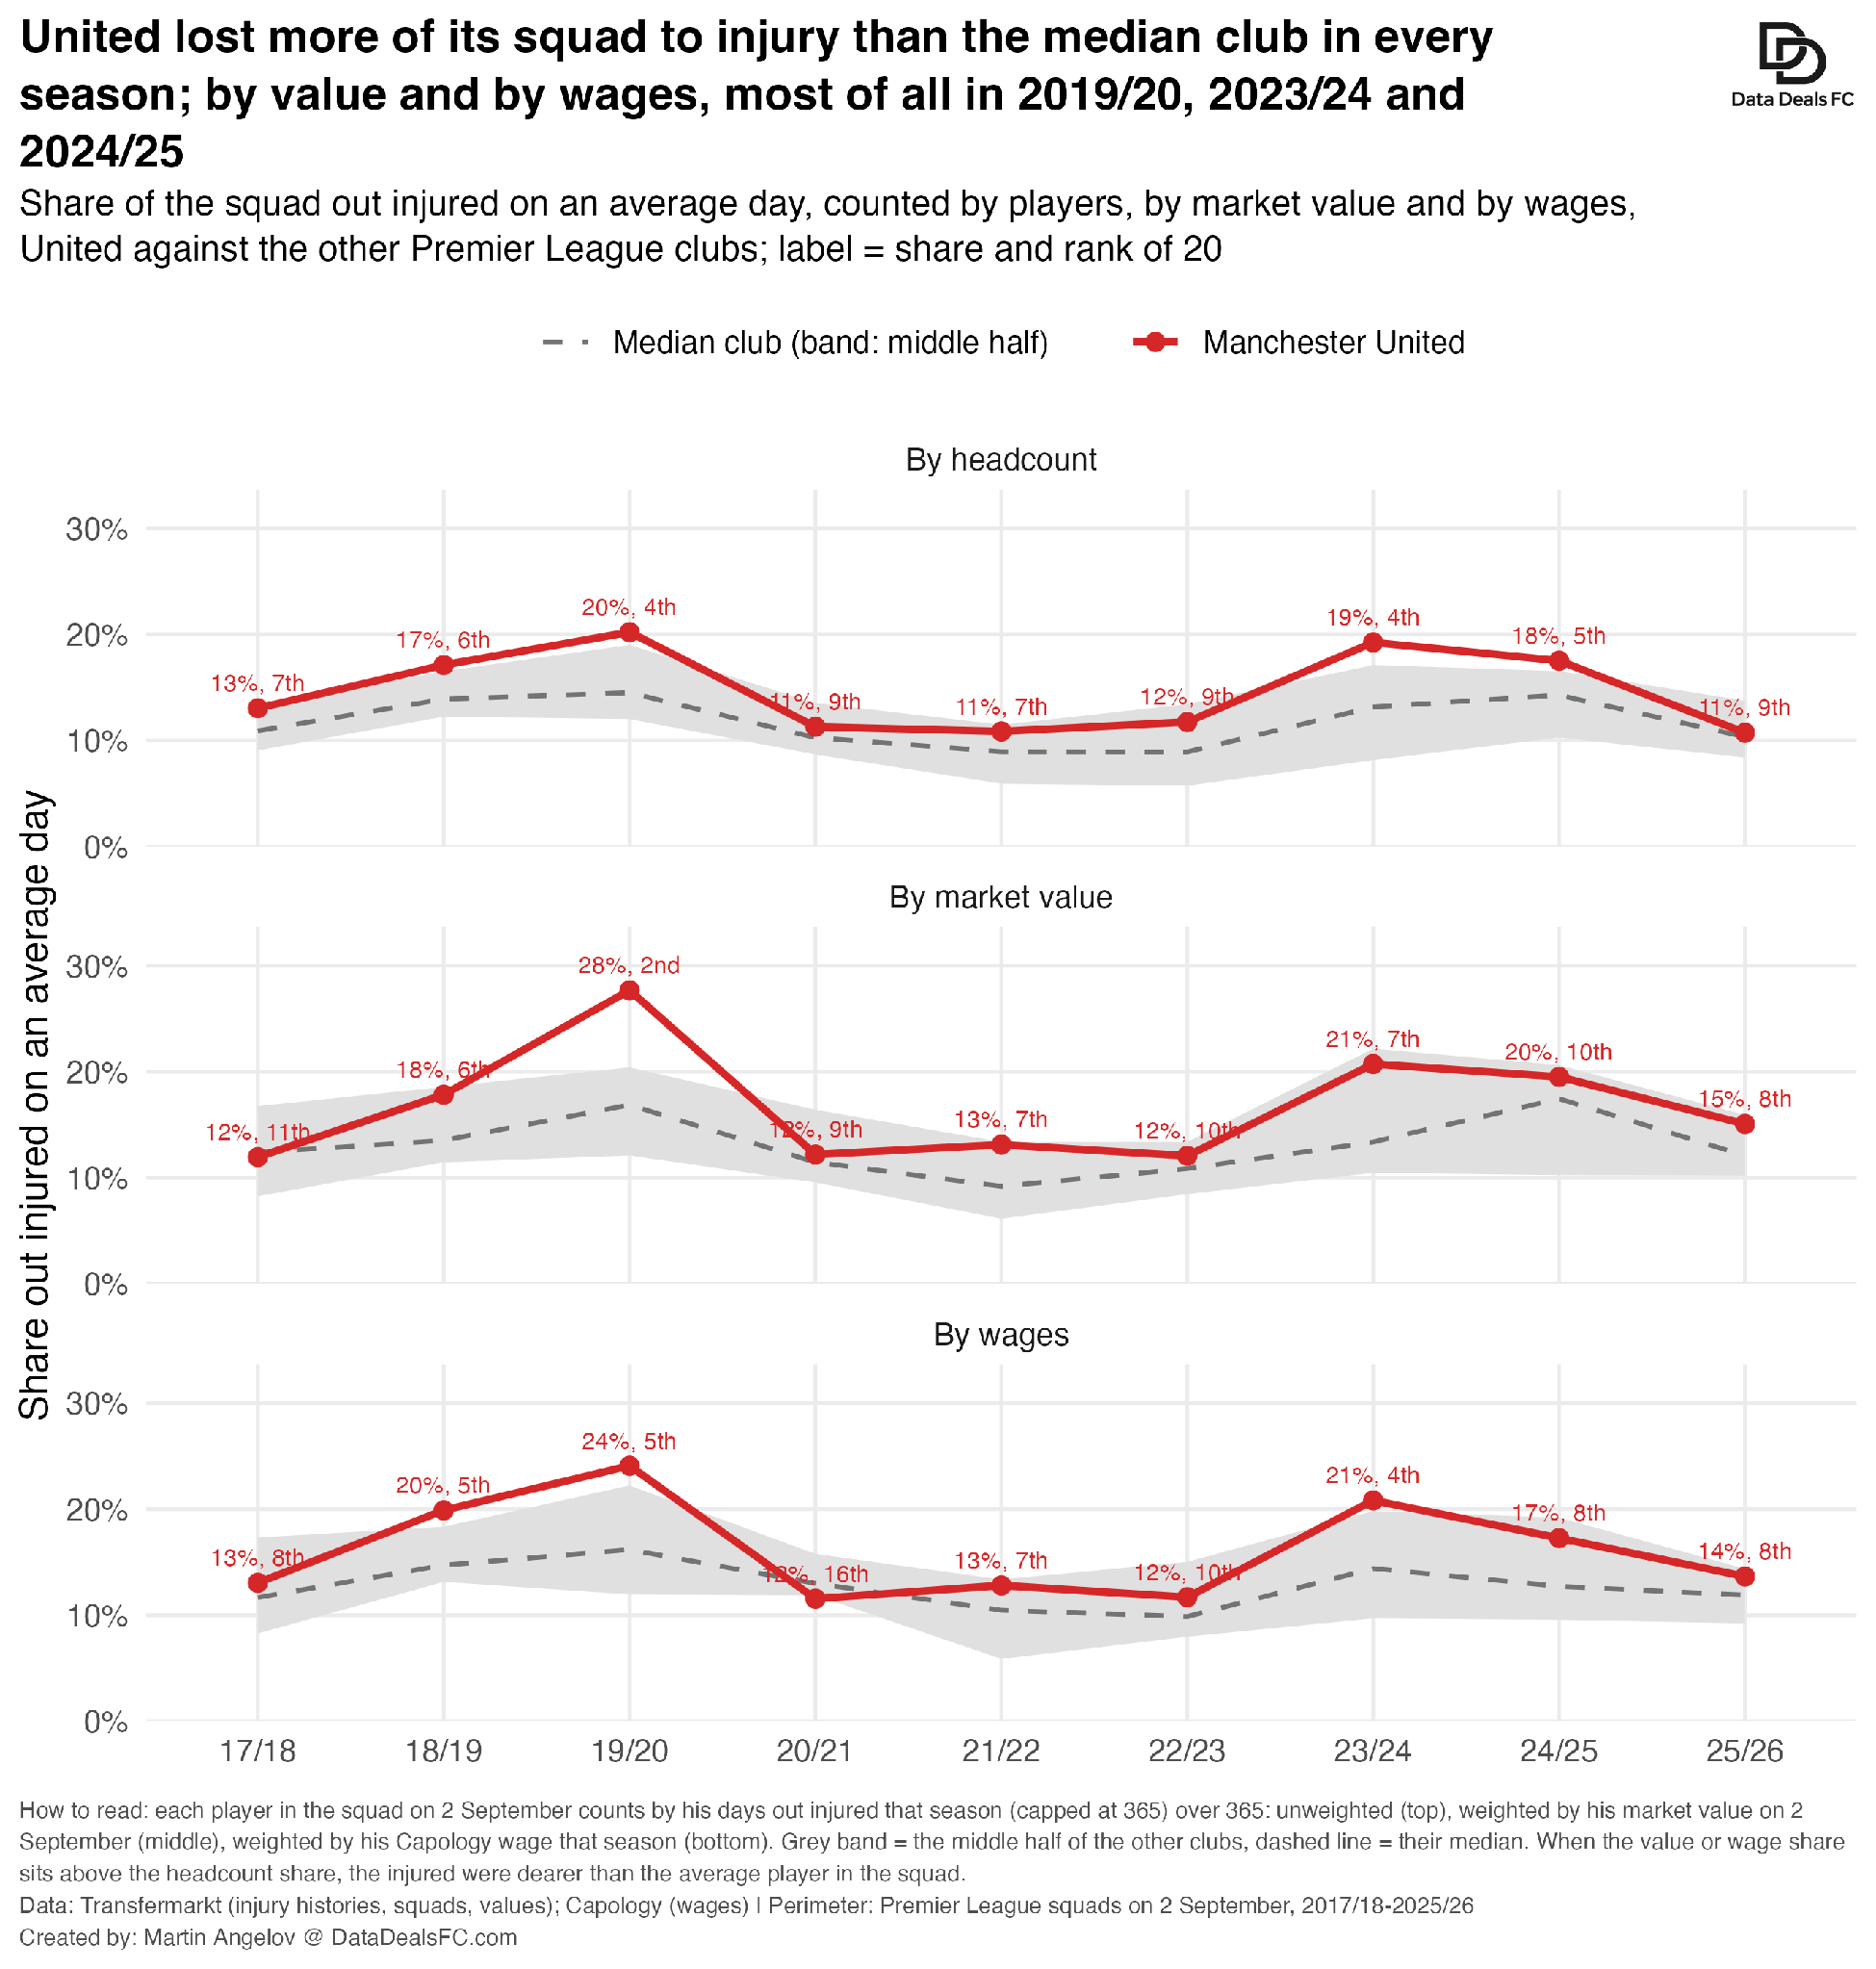
More than at most clubs, but mostly through numbers rather than price. In every one of the nine seasons a larger share of United’s squad was out injured on an average day than at the median club. Weighted by market value, 28% of the squad’s value was missing on an average day of 2019/20, against a league median of 17%, and about a fifth in 2023/24 and 2024/25.
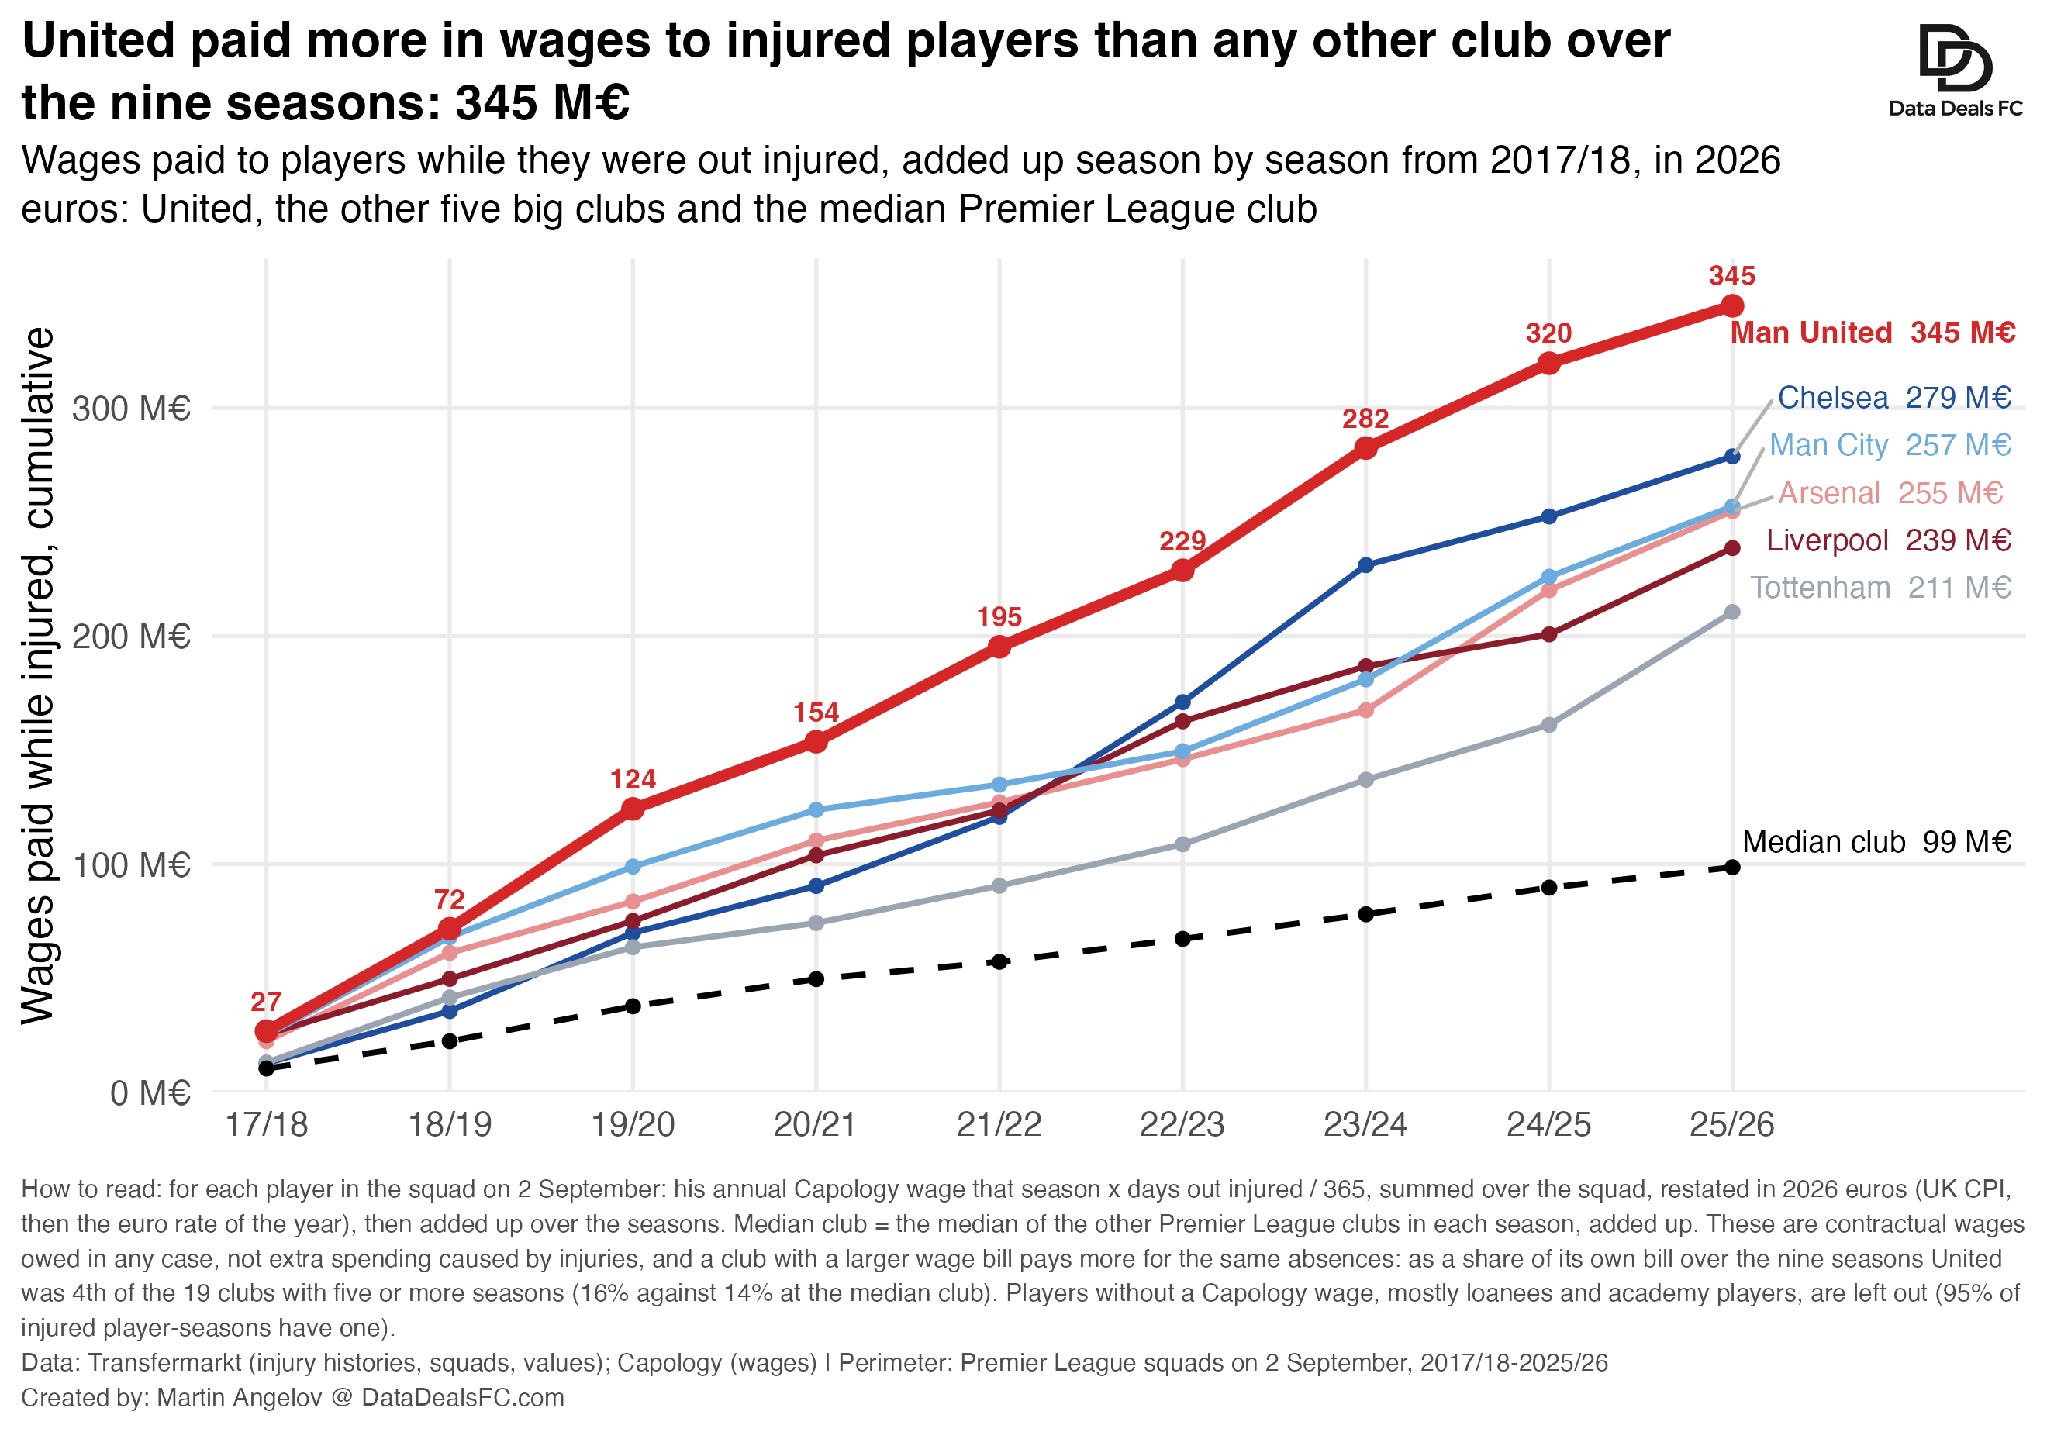
Counting each injured player’s contractual wage for the days he was out, United paid about €345M to players while they were injured over the nine seasons, more than any other club. Those are wages the club owed in any case, not extra spending caused by injuries, and United’s wage bill is large. As a share of its own bill the figure is 16%, 4th of the 19 clubs with five or more seasons in the league, against 14% at the median club.
Whether the injuries caused the bad results or the same squad problems caused both, the data cannot say. Three of the four heaviest injury seasons were among United’s worst for money; 2019/20, the heaviest of all, was not. That suggests the injuries deepened bad seasons rather than causing the long-run shortfall.
3. Where did the money go?
The second half of the explanation is what happened to the money. Since 2017/18 United has spent €2.2 billion on transfer fees, in 2026 euros, and received €610M back: the largest net spend in the league.
Did United overpay to buy?
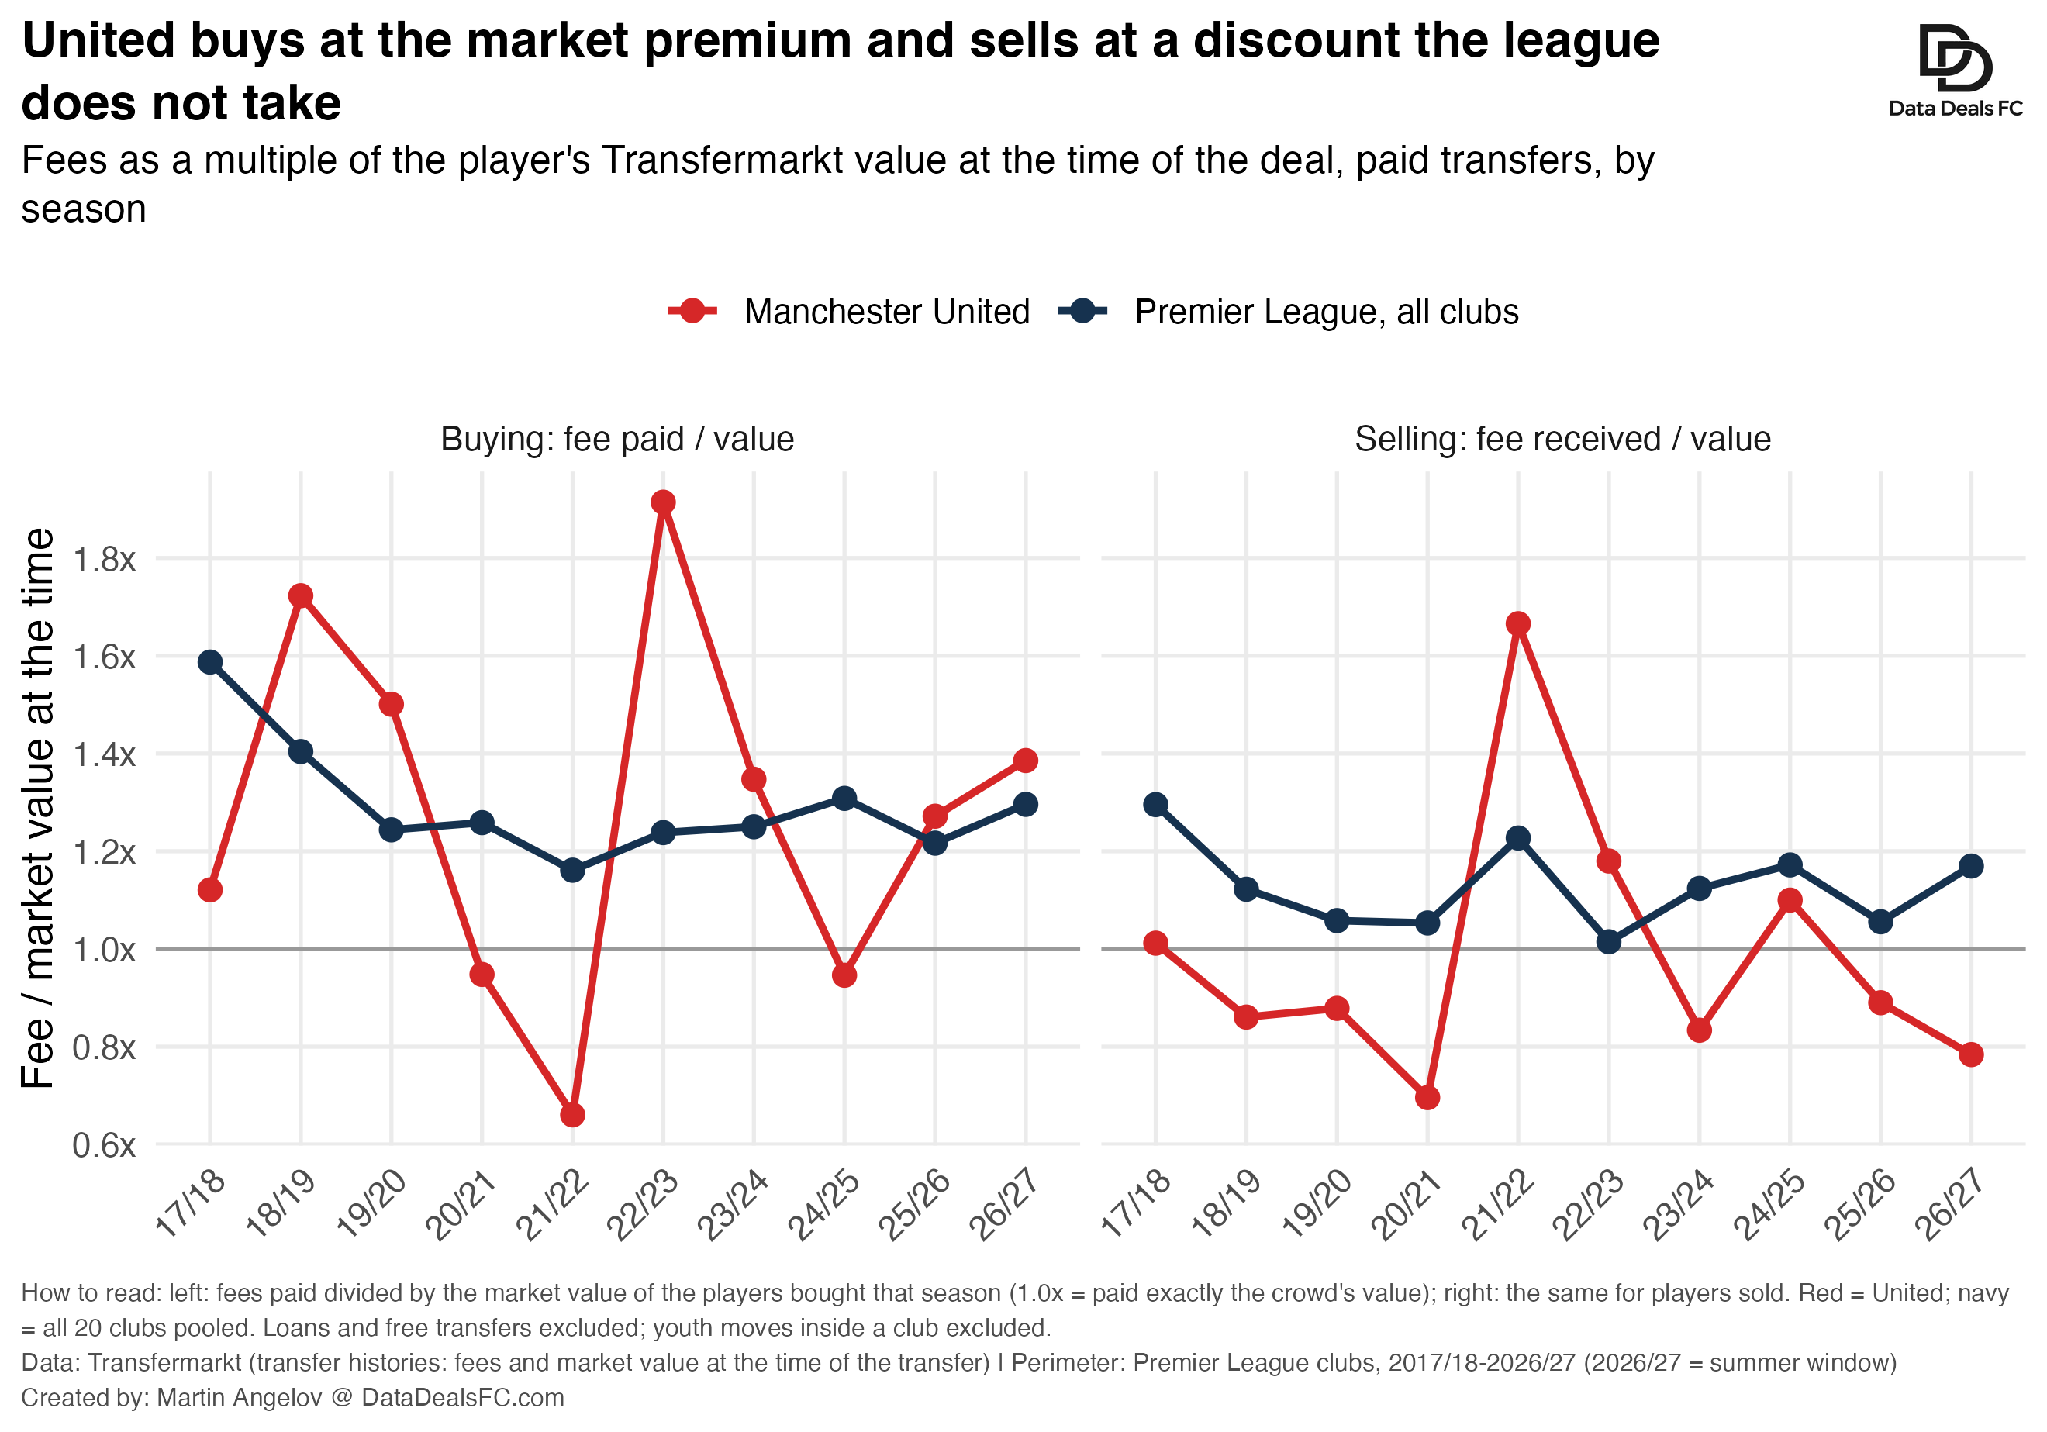
No. When buying, United paid 1.20 times the players’ market value at the time, against 1.28 across the league: the premium a buyer pays for the players it wants was normal. The difference is at the exit. When selling, United received 0.94 times market value, where the league as a whole received 1.13, and it sold below value in six of ten seasons.
What came back from the signings?
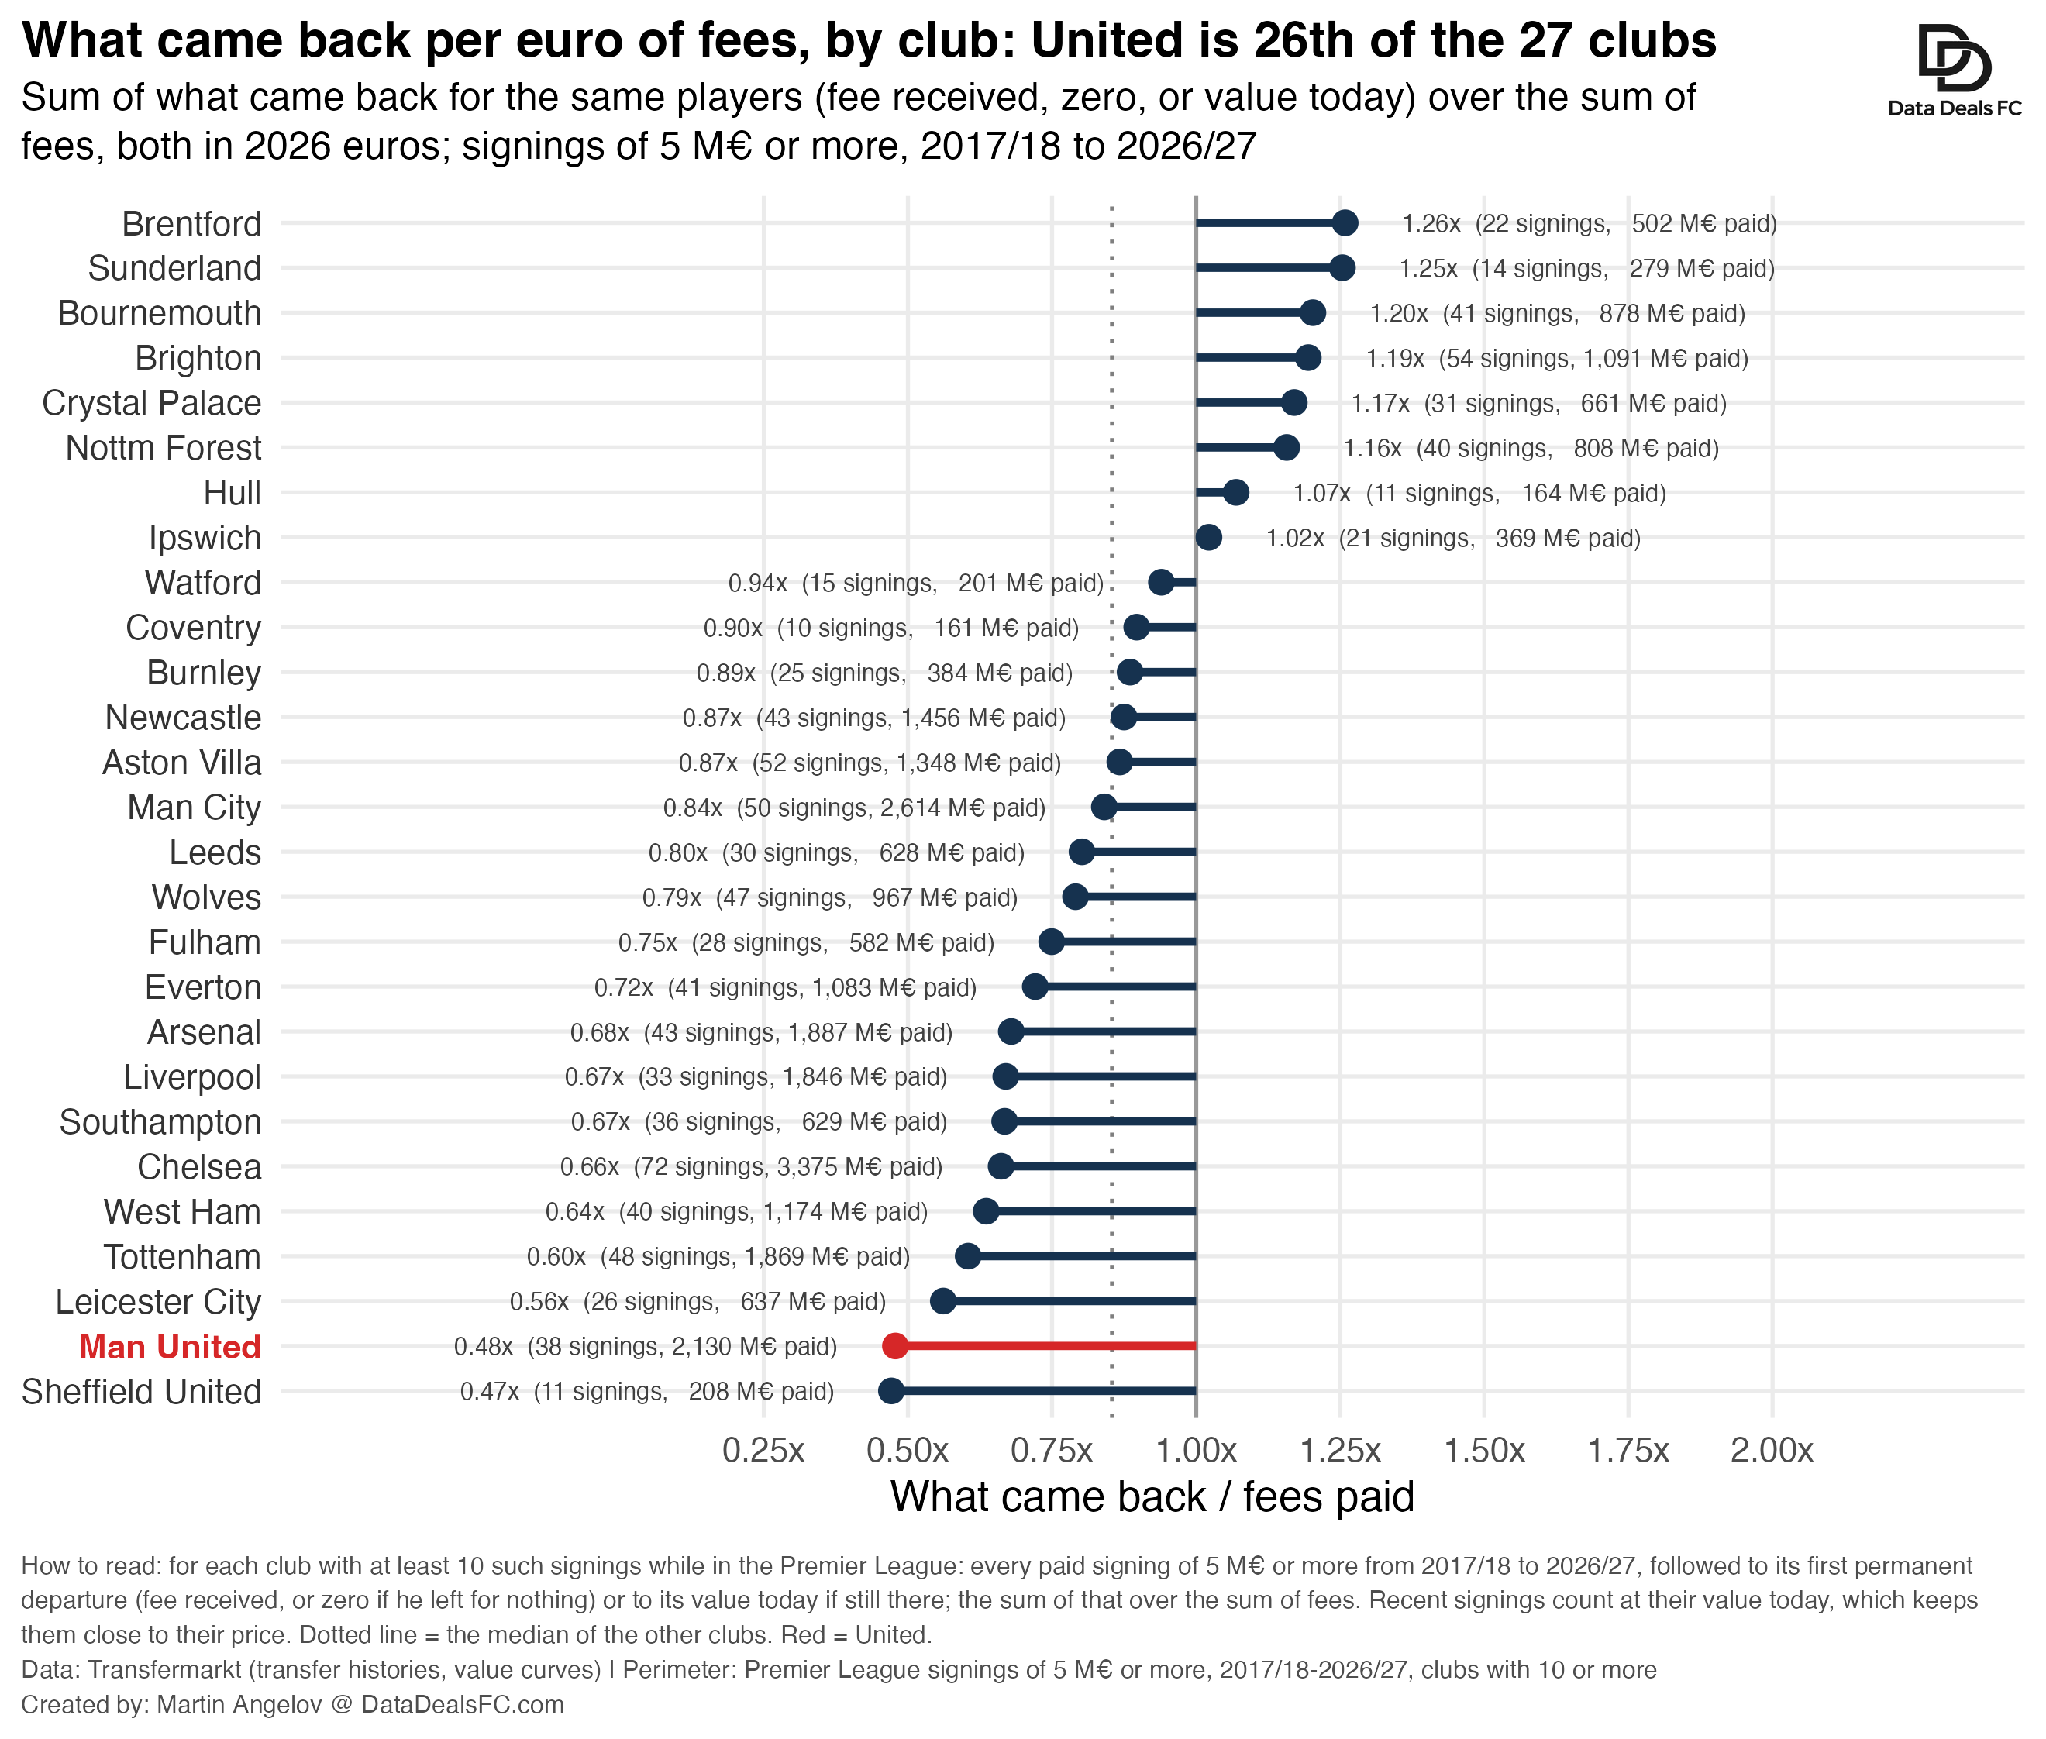
To answer that, I followed every signing to its outcome: the fee received if the player was sold, nothing if he left for nothing, and his market value today if he is still at the club. Run for every club with ten or more signings of €5M or more, it gives a simple ratio of what came back for each euro of fees.
United got back €0.48 for every euro. The median club got back €0.85. United ranks 26th of 27; only Sheffield United did worse.
A raw ledger is not a verdict on its own. Players age, and a fee is rarely recovered five years later, so I set each signing against what signings of the same age, held for as long, usually bring back across the league. United still gets 69% of the usual, still 26th of 27.
The detail is the interesting part. The players still at the club are close to what age and time alone would leave (89% of the usual). The players United sold fetched about half of what similar players usually fetch (54%), and several left for nothing. That points to selling late and from weakness, players the club no longer wanted, more than to paying too much in the first place.
Did the coaching changes play a part?
United has had six coaching regimes since August 2017. That is the league median, but the clubs that win almost never change mid-season: Manchester City had two regimes in the period and Arsenal three.
Across the league, a signing made under a coach who left within a year brings back 42% of his fee at the median, against 63% when the coach stays. 51 of United’s 55 signings since 2017 were made by coaches who have since gone.
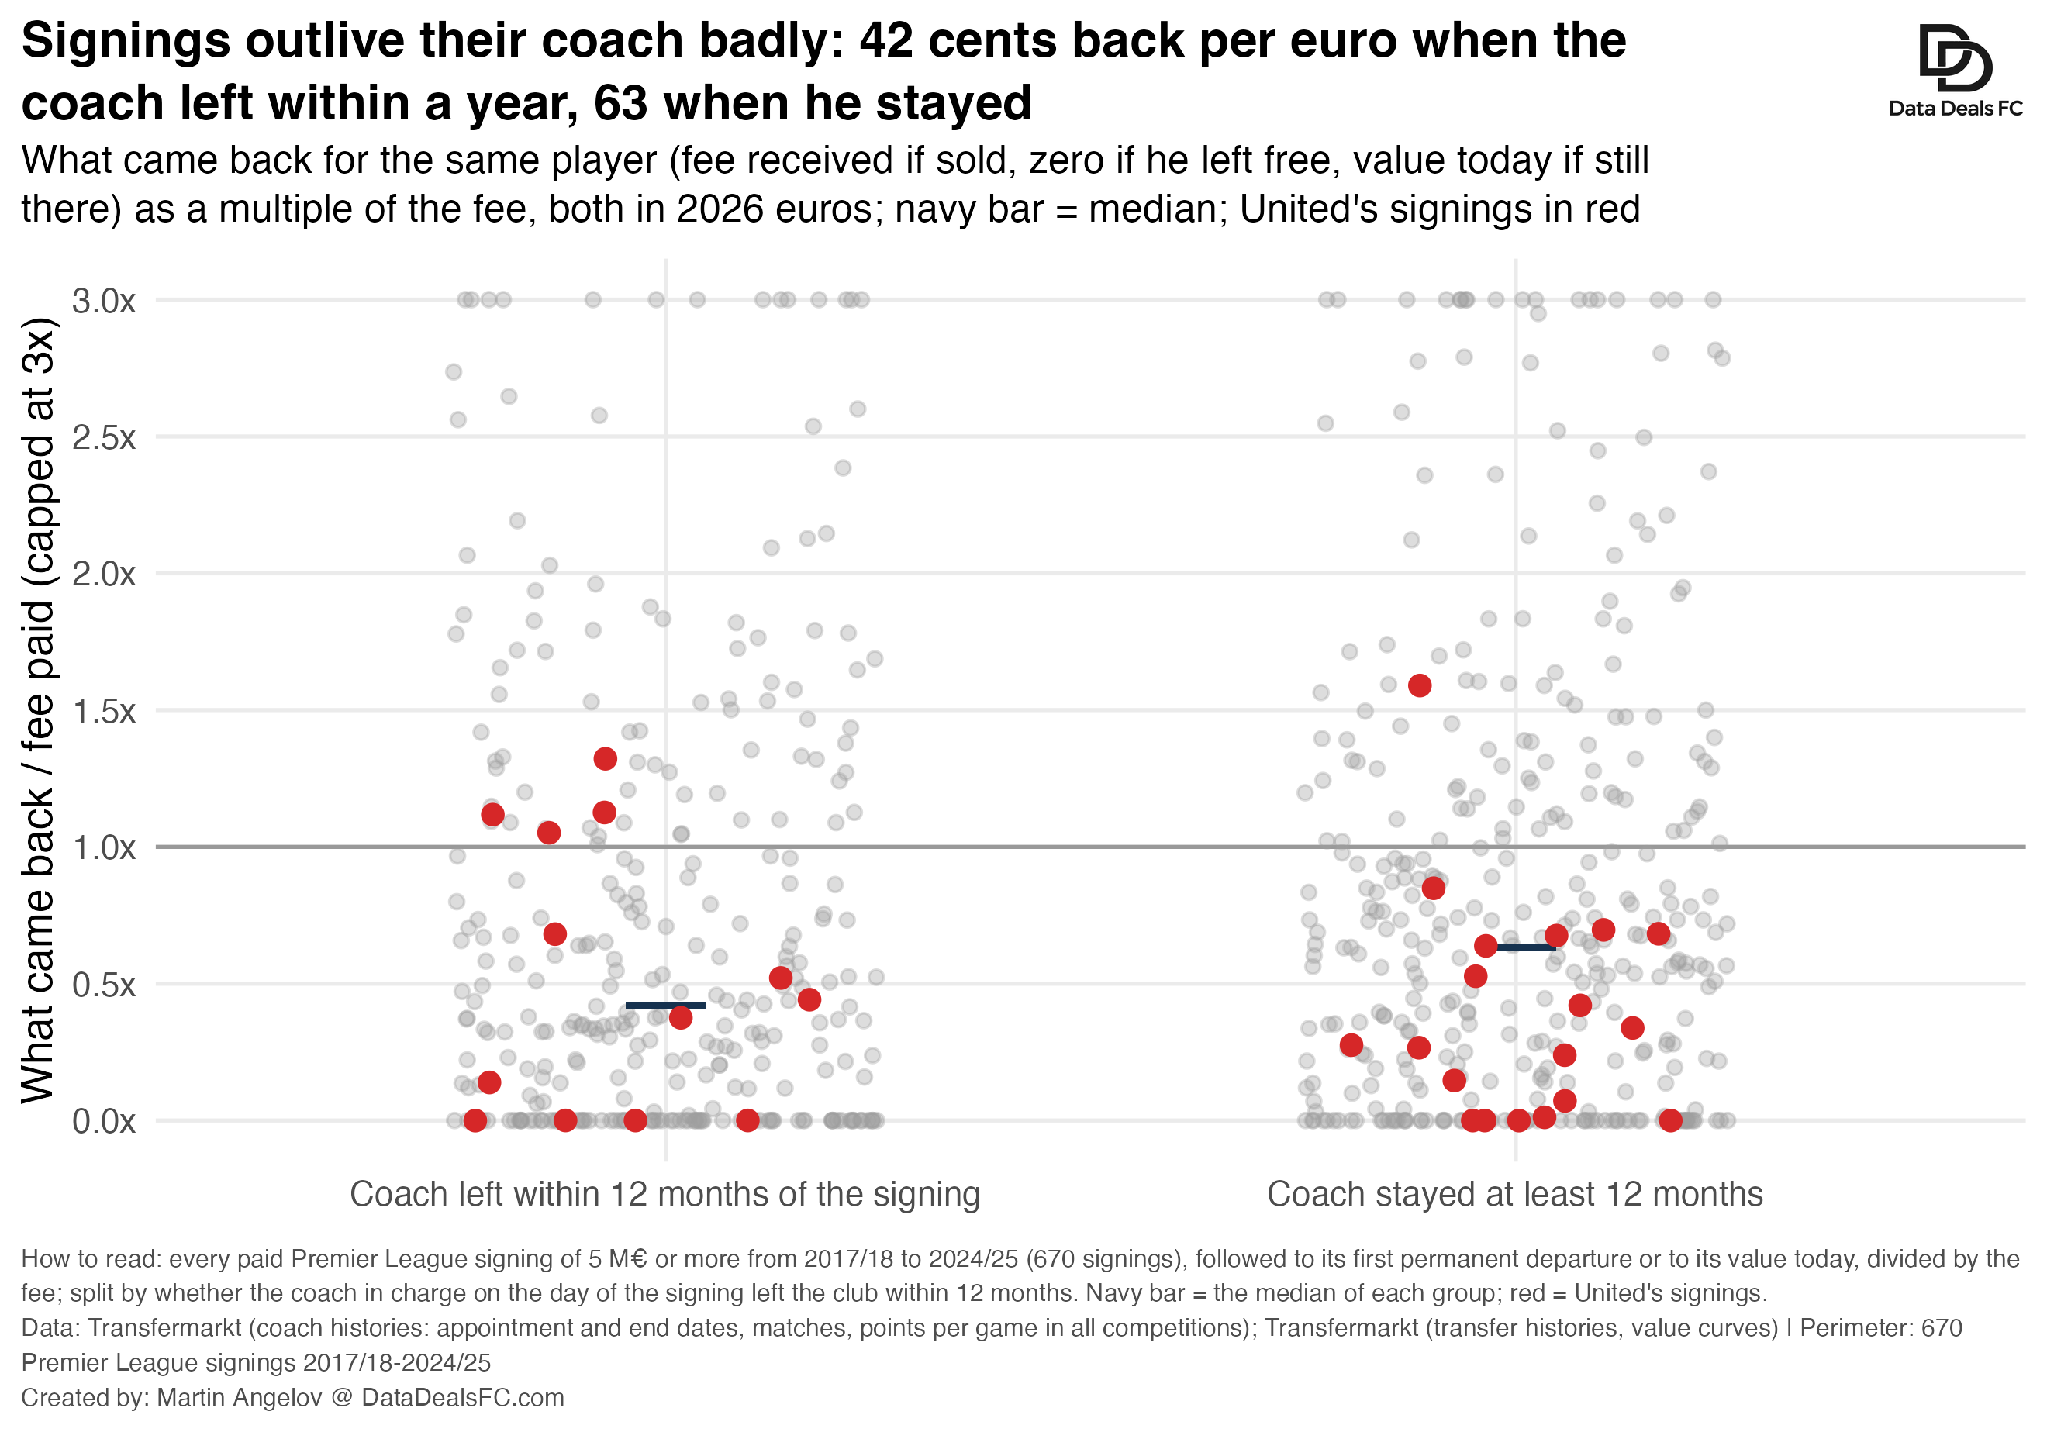
Clubs sack coaches because seasons go badly, so this is an association, not a measured effect. The mechanism is plausible, though: each new coach buys for his plan, and each departure leaves players recruited for a plan that no longer exists. The result is a squad whose value fell over the year in seven of nine seasons, by 5% a year on average, while the median club’s squad gained 4%. Much of the transfer budget went on replacing value the squad had lost.
4. What does the squad look like today?
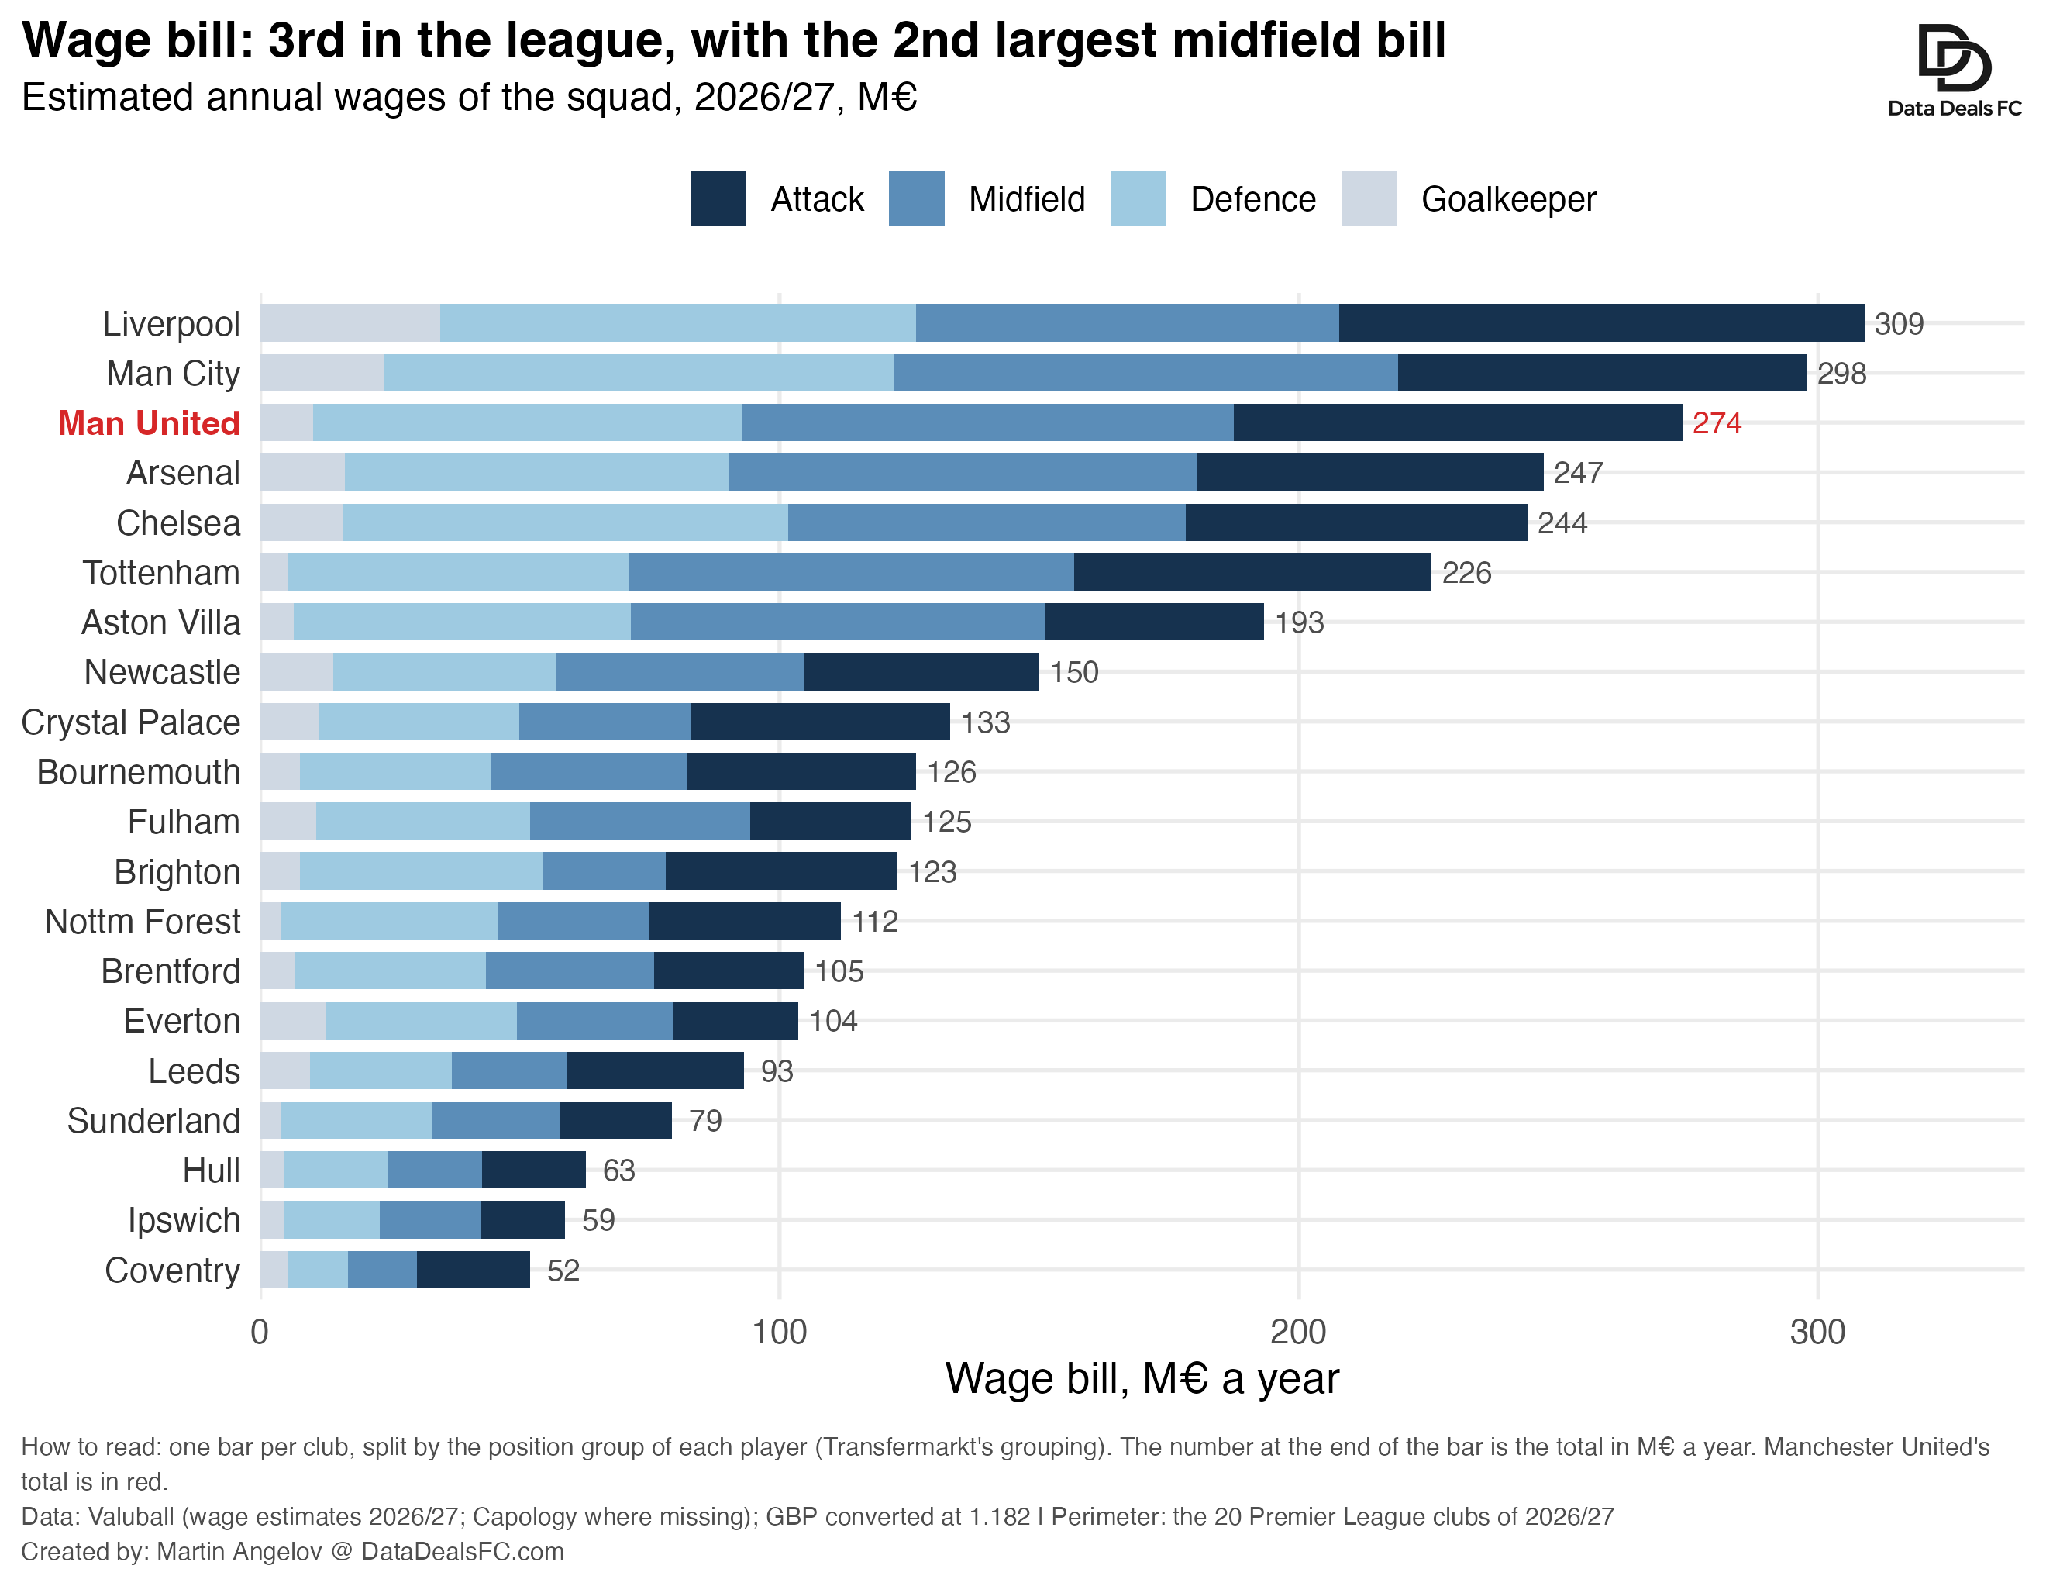
Young value, old wages. United’s squad is the 5th most valuable in the league, at €929M, and its wage bill the 3rd largest, at about €274M a year. The value is young and sits in the attack, much of it bought in the last two windows.
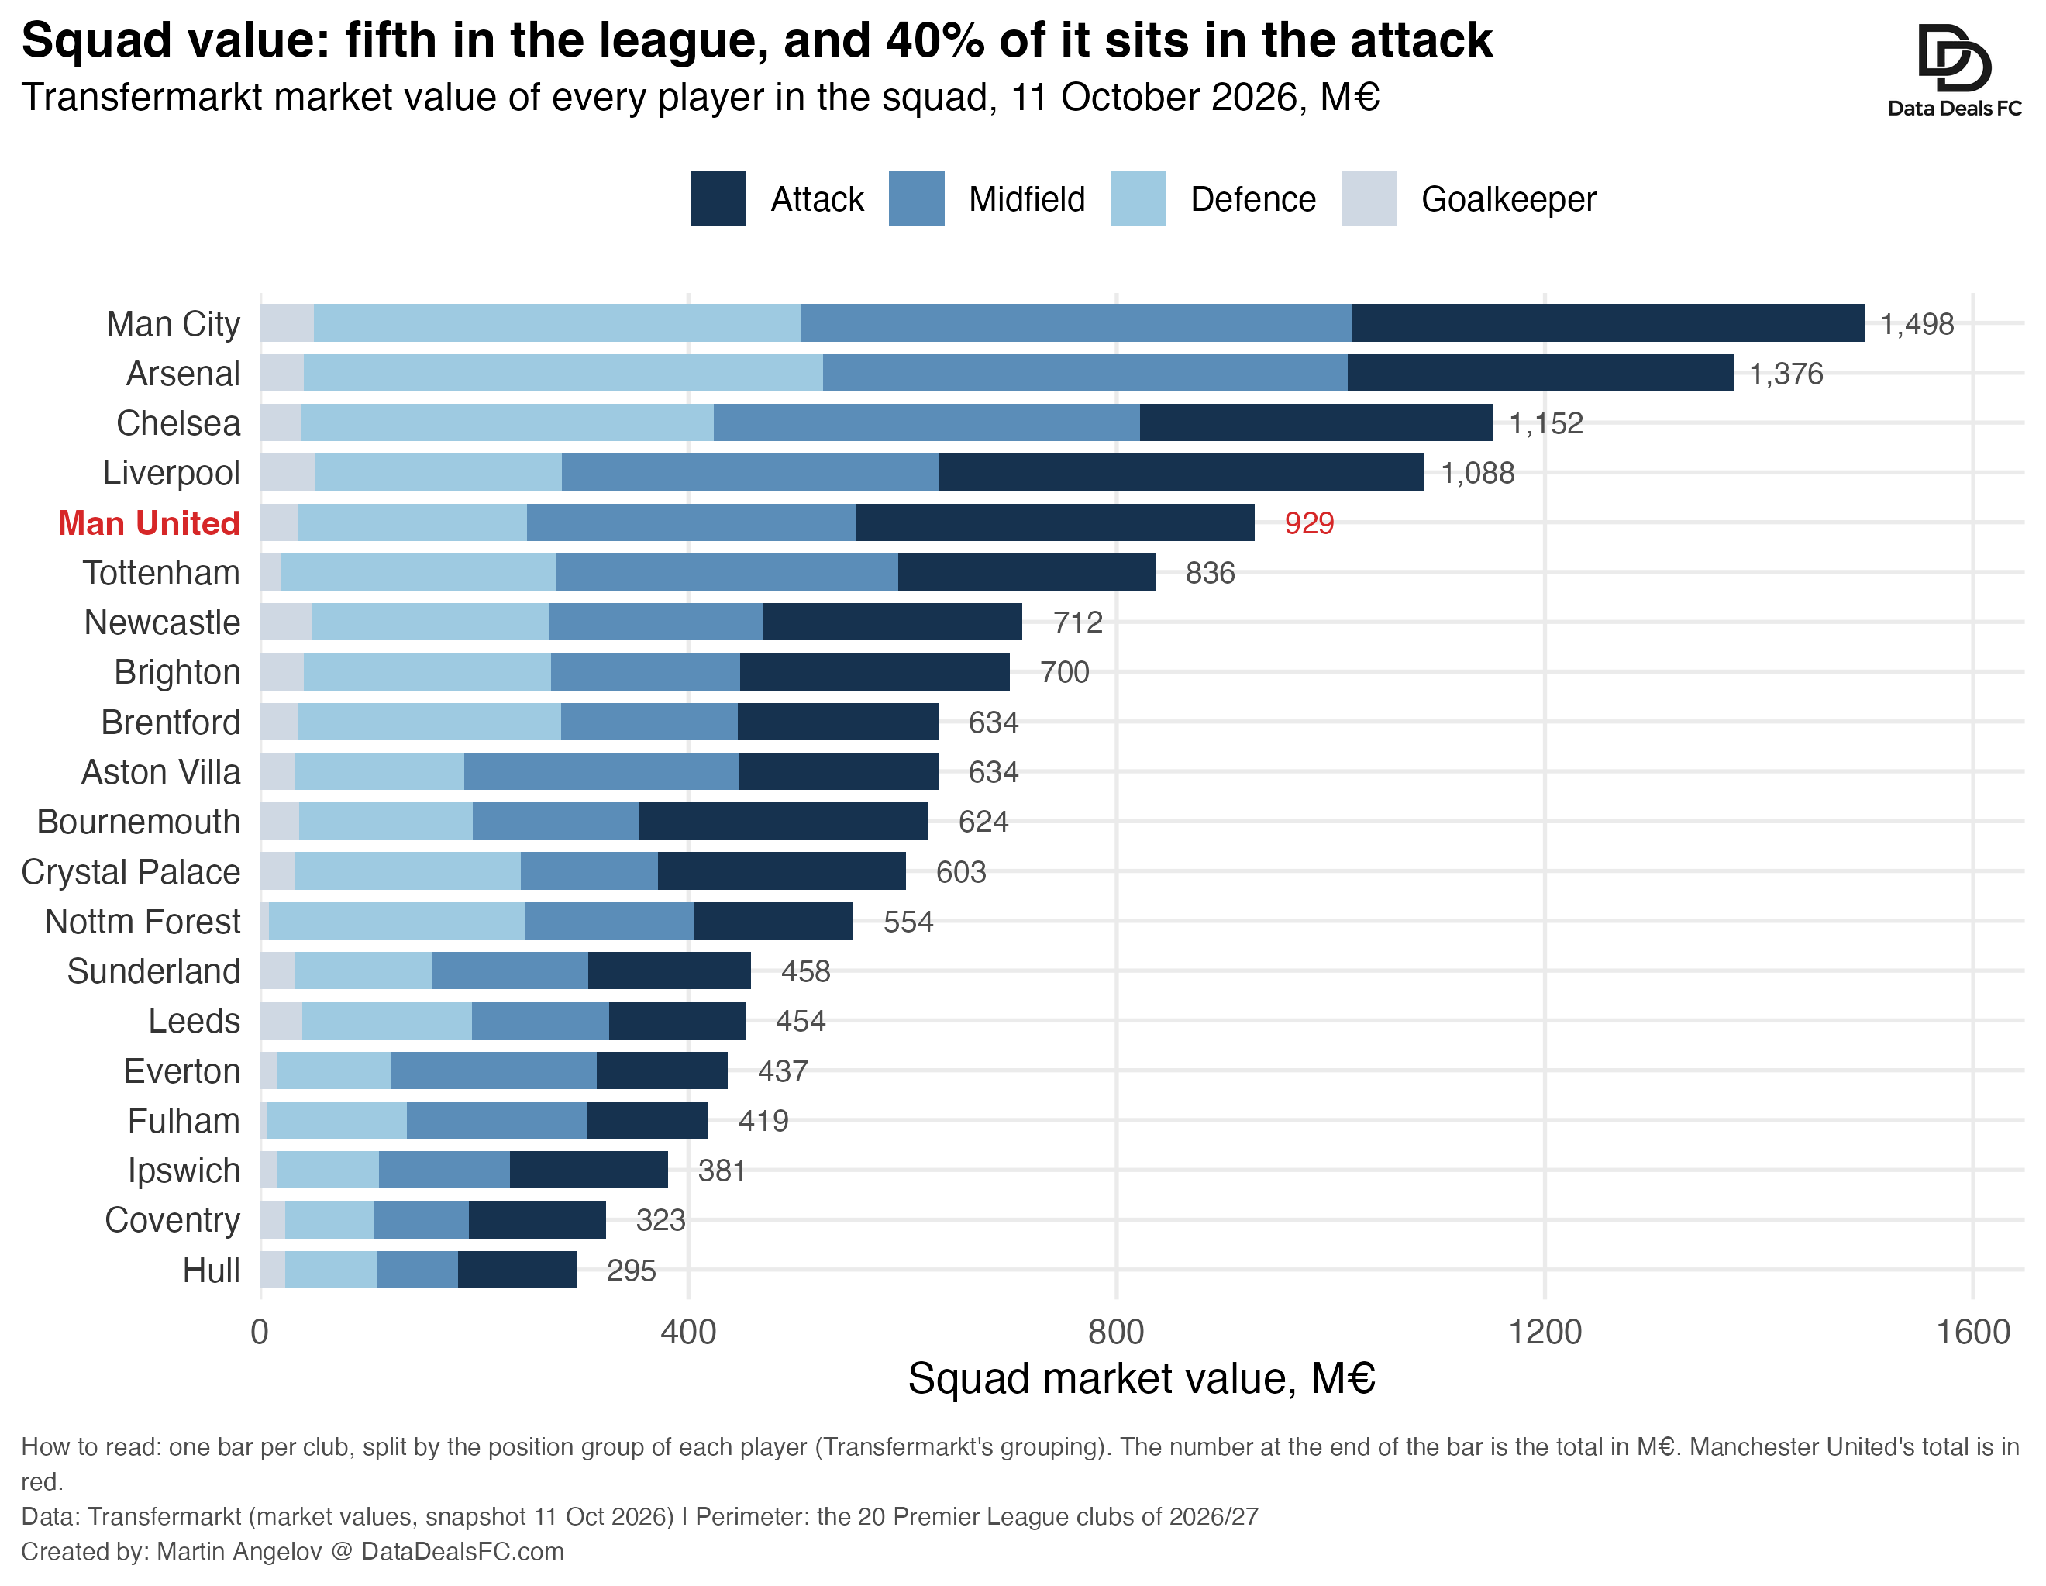
The wages are older and sit in the midfield, the defence and a senior core whose contracts were set when their value was much higher.
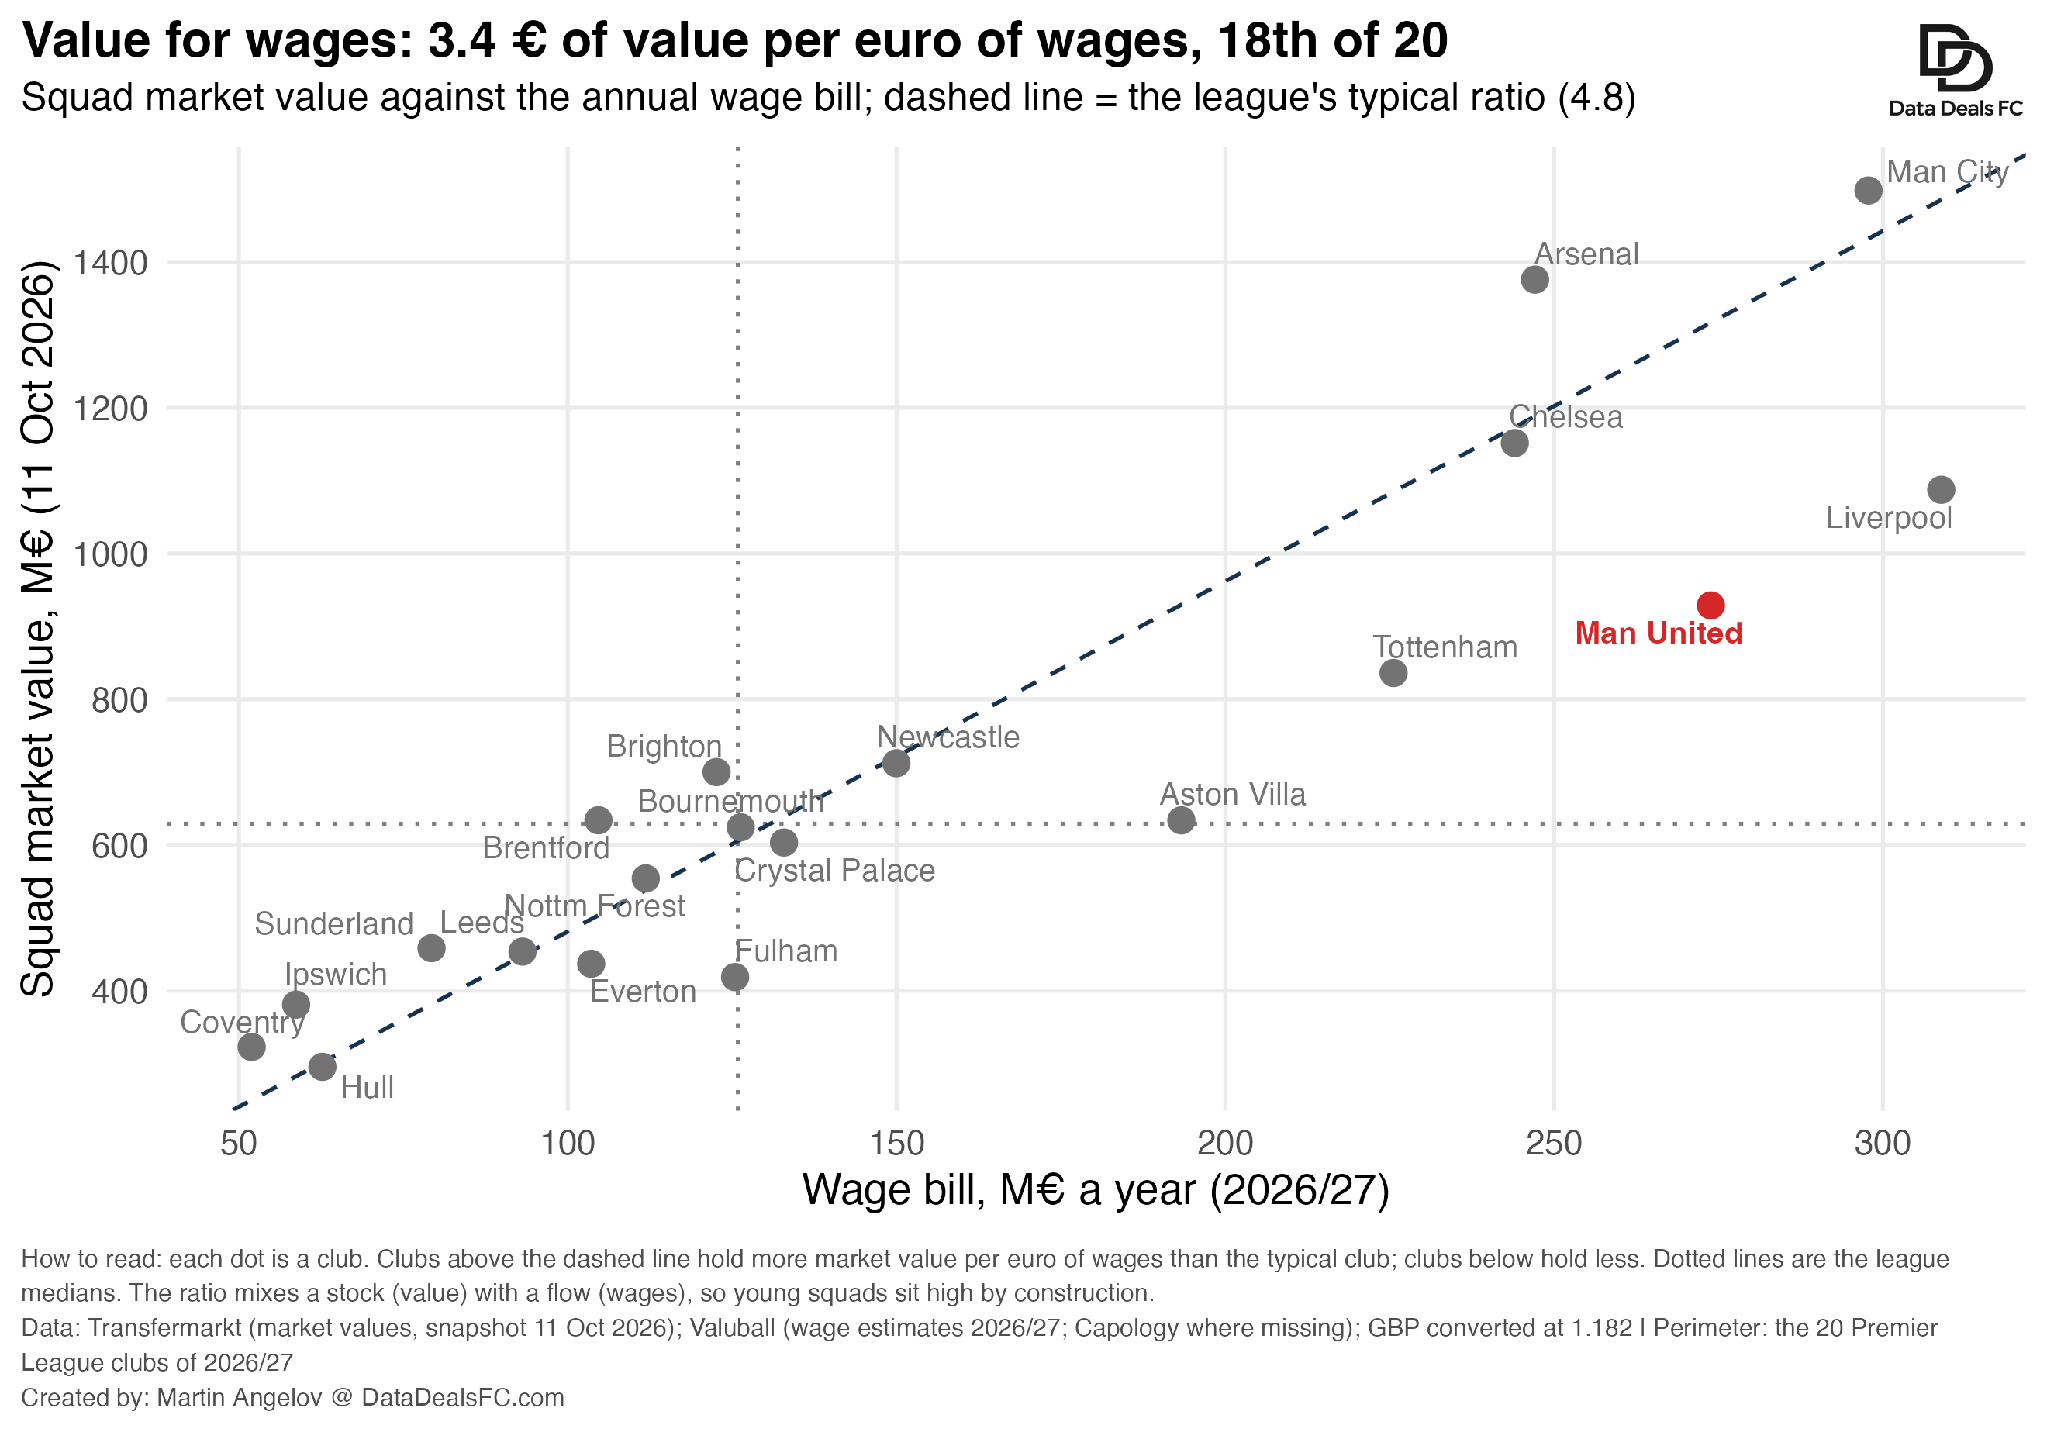
The single number that sums it up: United holds €3.40 of squad value for every euro of annual wages. The typical club holds €4.80, and Arsenal, with a similar bill, €5.60. United ranks 18th of 20. Its four best-paid players take 28% of the wage bill and hold 13% of the squad’s value.
Figure 11. Squad market value against the annual wage bill, 20 clubs of 2026/27.
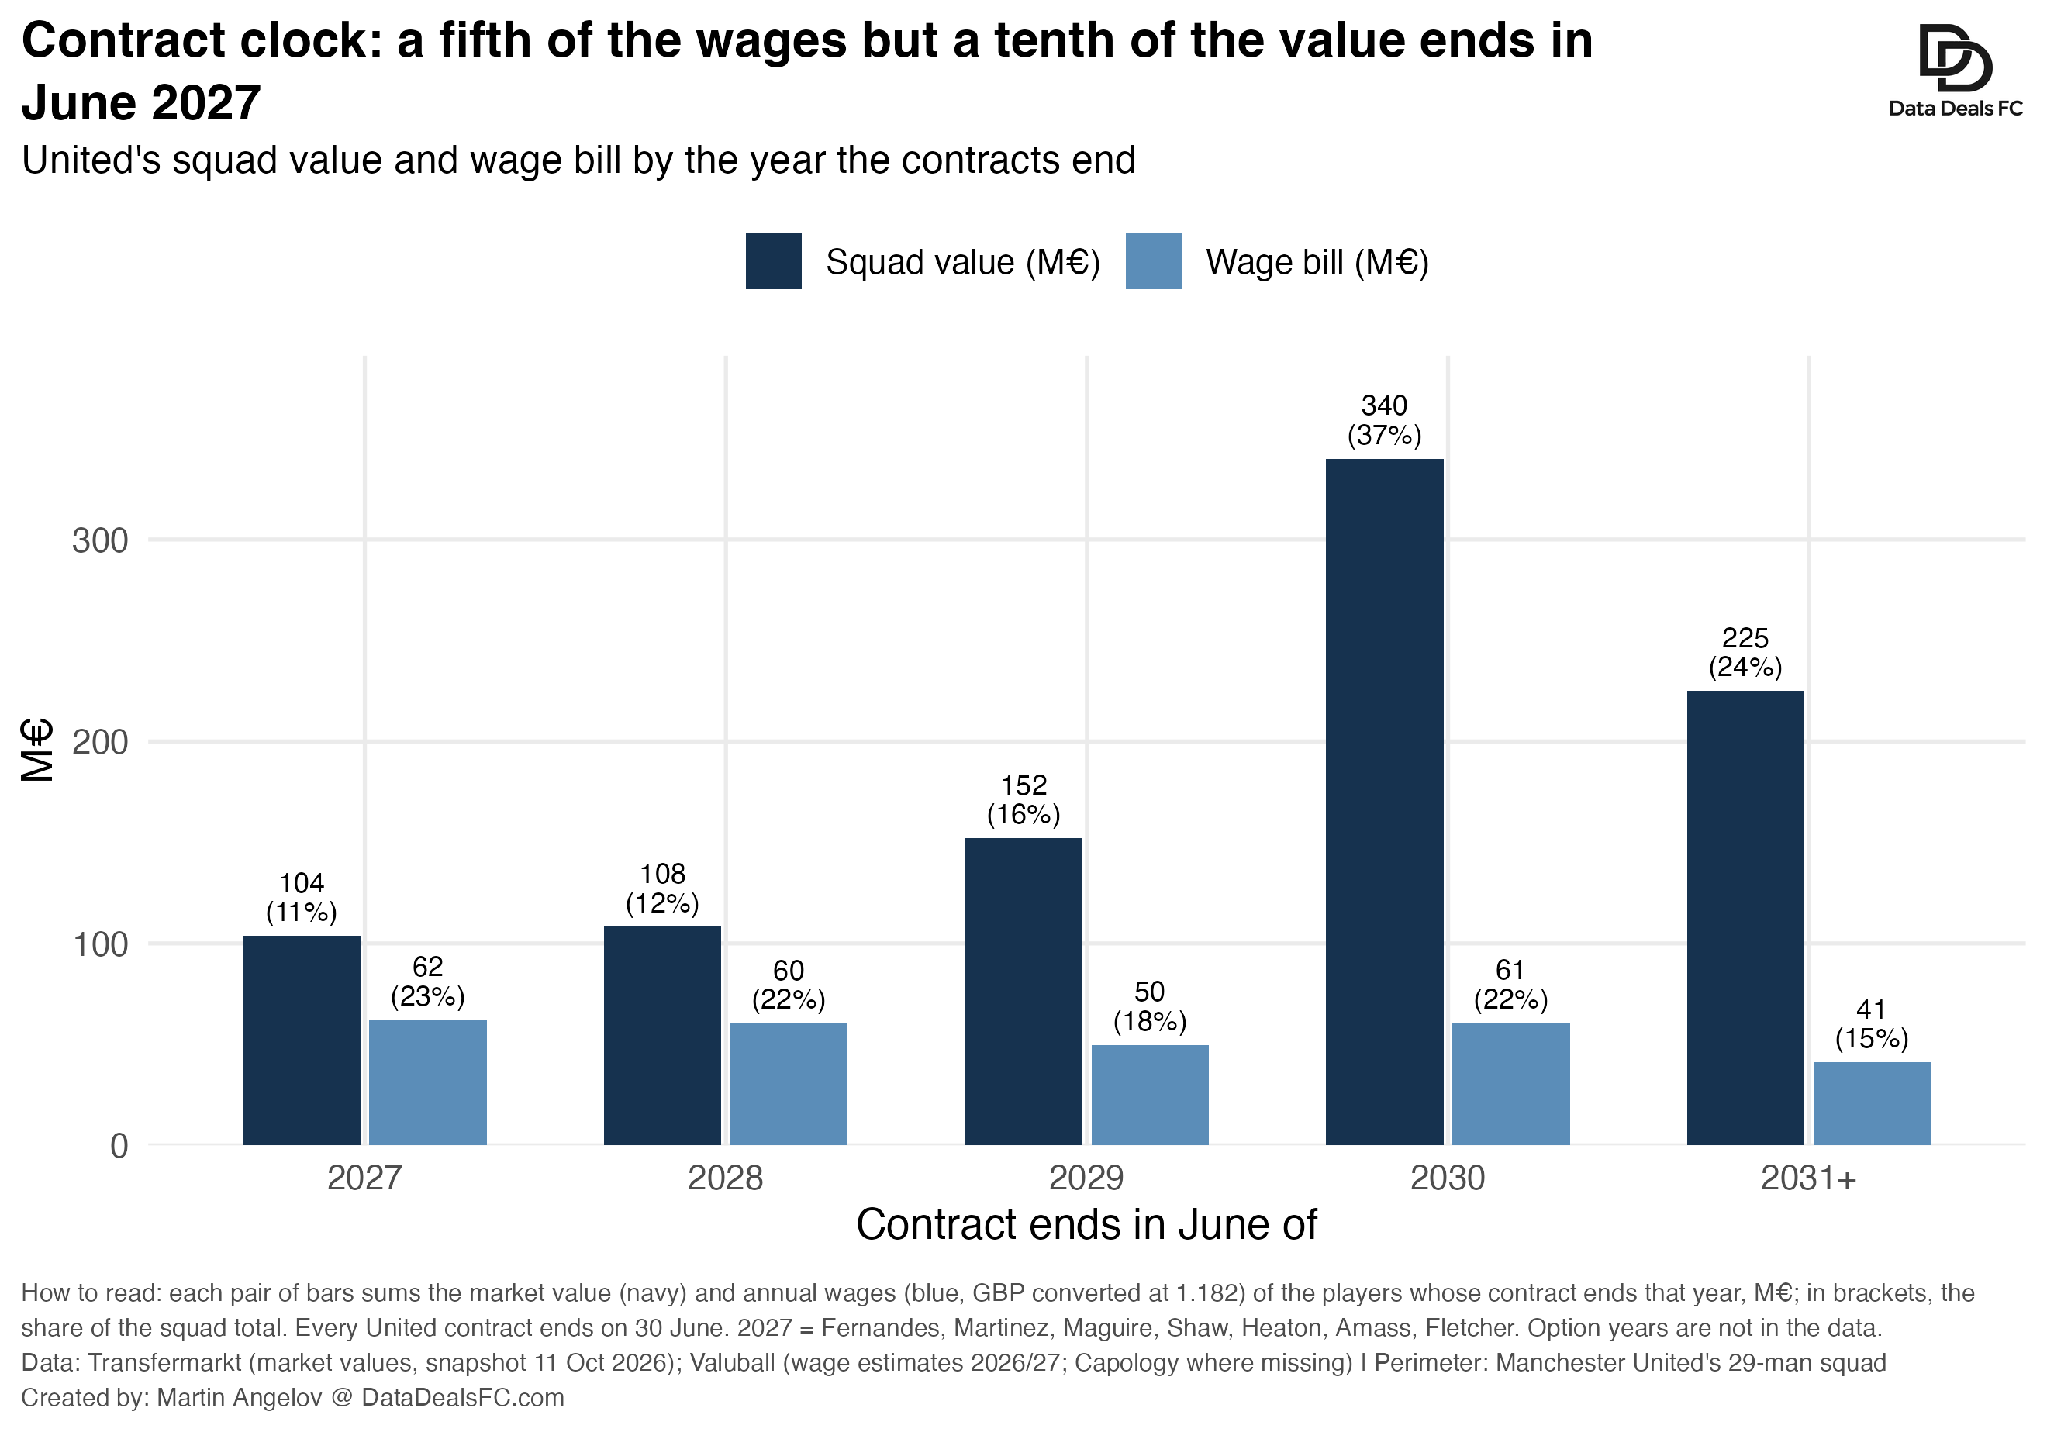
The next big decision is close. The contracts ending in June 2027, Fernandes, Martínez, Maguire and Shaw, carry 23% of the wage bill, about €62M a year, and 11% of the squad’s value. Three of the four are defenders, in the line the club pays furthest above its value.
Not every expensive contract is poor value. Measured by the chances he made, Fernandes added 8.5 expected points in 2025/26 above a replacement-level player, the most in the Premier League, at €2.5M of wages per point against a league median of €5.1M. With him on the pitch, United’s expected-goal difference was almost a goal per game better than without him over the last three seasons.
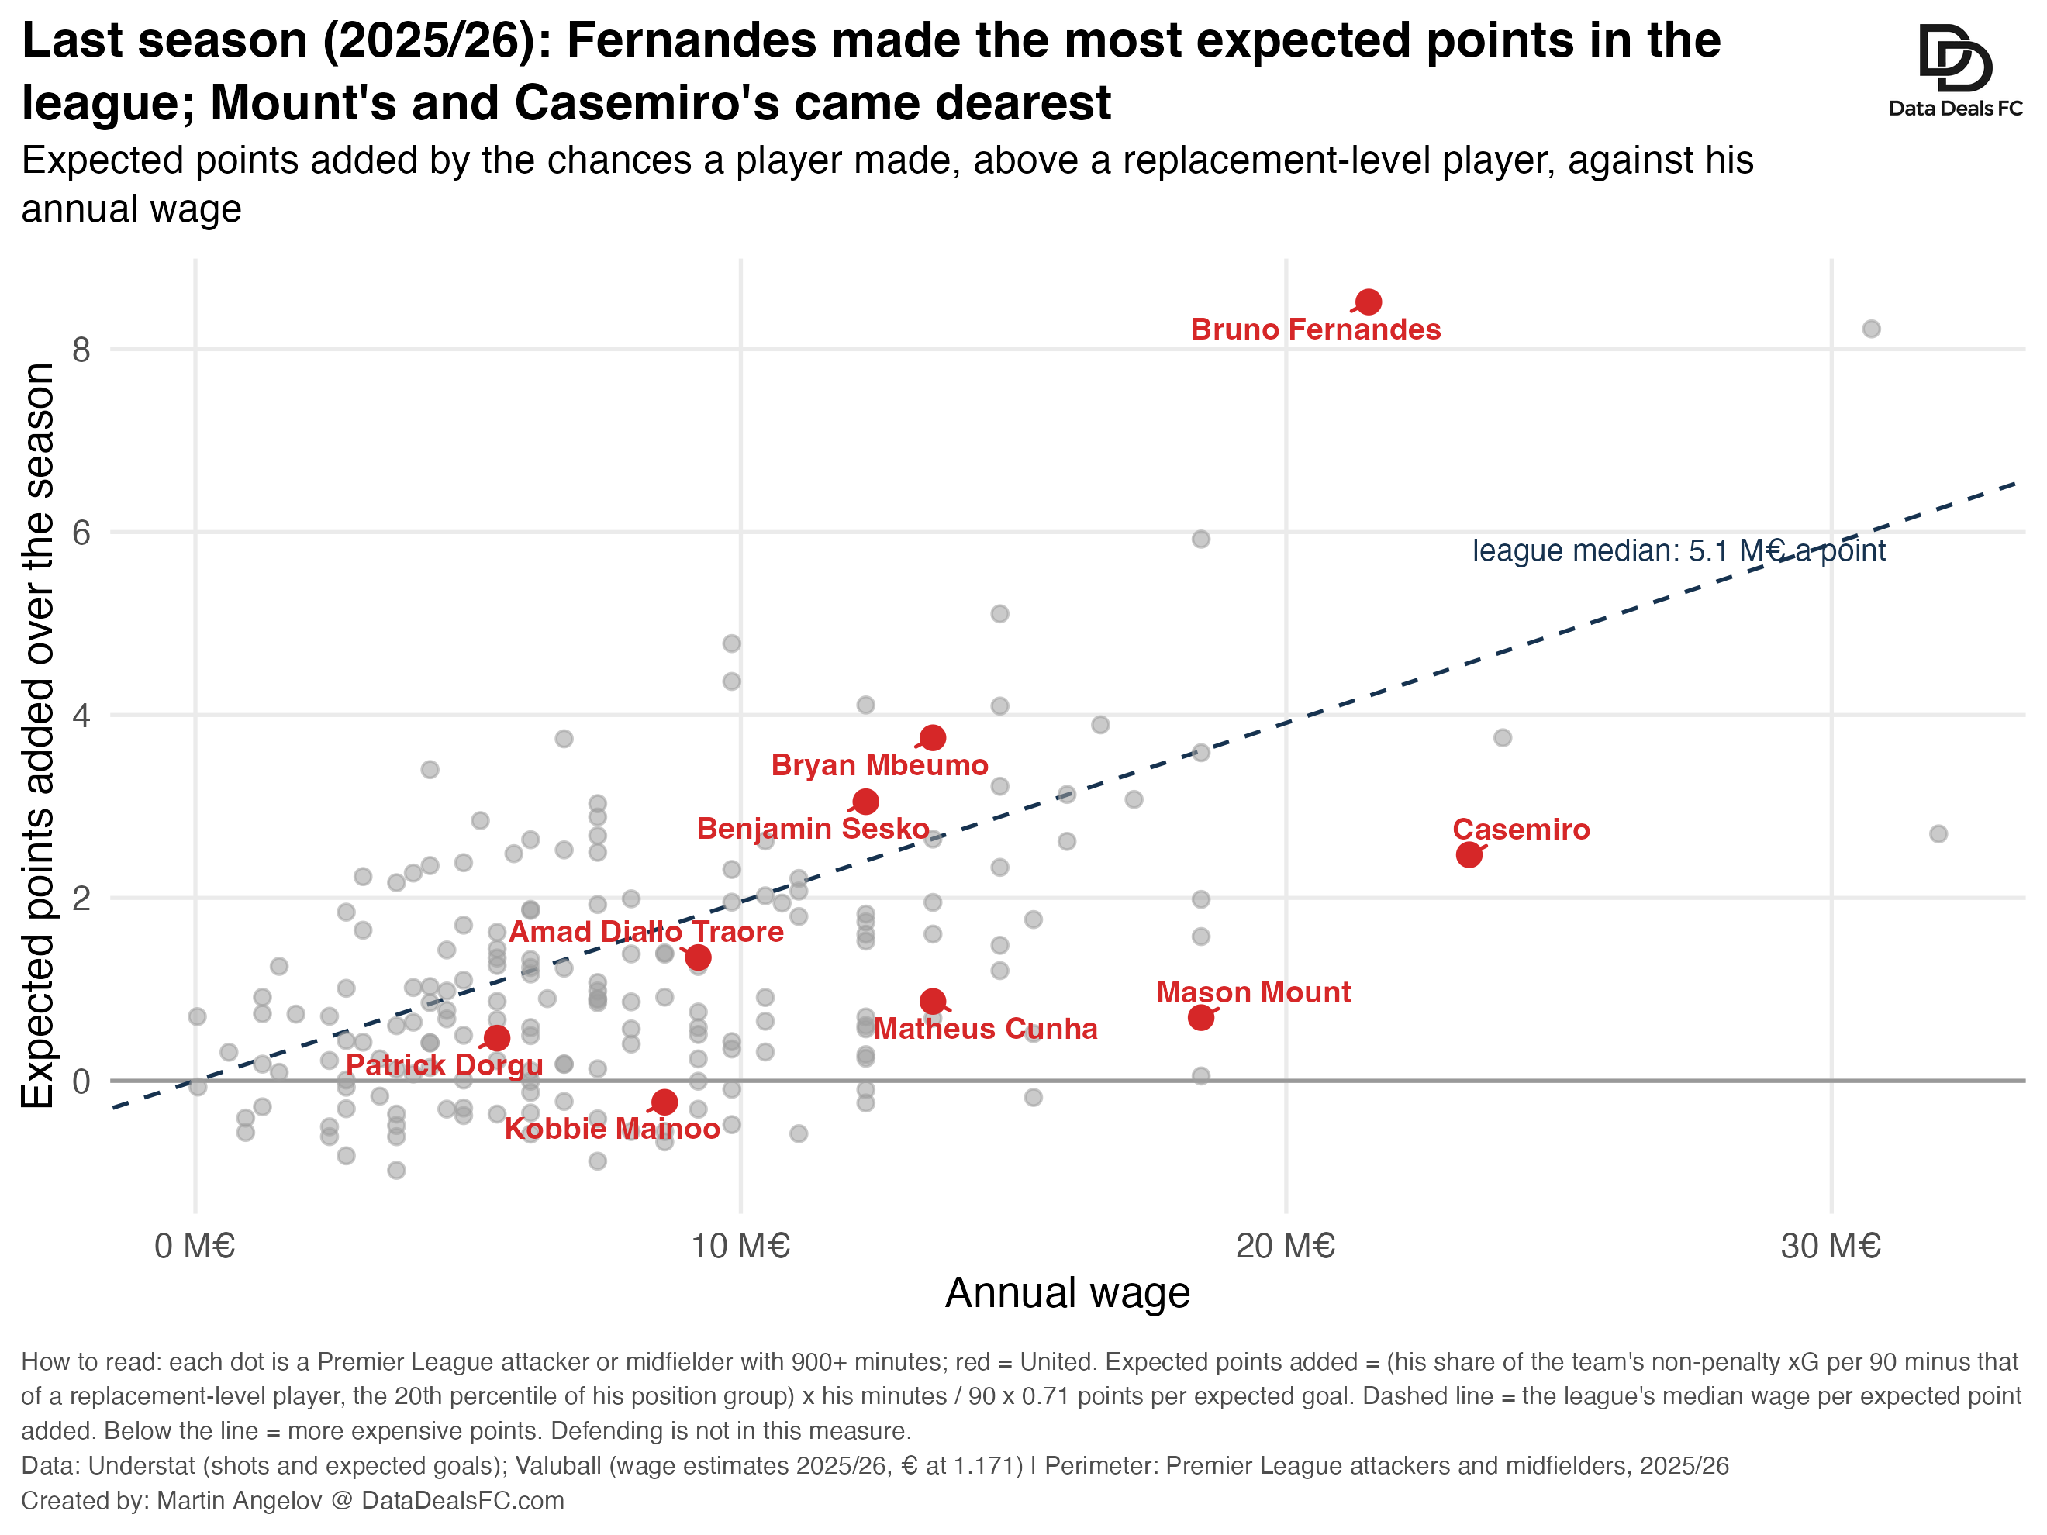
One caution on individual players. The performance index in the report measures what a player did in his team’s system that season. For a young player in a new side it is the least reliable number in the report, and a low score is not evidence that a transfer was a mistake or that a player lacks potential.
5. What would show that United has turned?
The audit cannot say whether the improvement of 2025/26 will last, and five rounds into this season United sits 12th with 5 points. What it can say is what to watch.
The first sign would be chances: a season in which United again creates what its wage bill usually buys, as it did last season for the first time in the period, without relying on points above its chances to get there.
The second would be the ledger: signings that hold their value, and players sold at or above their market value rather than below it.
The third would be stability: a coach who stays long enough for the players he signs to be worth what they cost when he goes.
None of these is a statistical question. The data shows where the money went and what it bought; what the club does with that is a judgement for the people who run it.
Boom — that was the Manchester United Moneyball Squad Audit, 2017/18 to 2026/27.
Hopefully you now have a clearer idea of why United underperformed.
If you only want to remember a few things, I’d pick these:
For years, United spent like a champion on wages but got the points of a club fighting for 5th place. United finished about 10 points a season short of what its wage bill usually buys (which is around 78 points over eight seasons).
United’s transfer problem is mostly at the exit. When it sells, it gets 0.94 times a player’s market value, against 1.13 for the league as a whole.
The players United bought for today’s squad are worth 70% of what they cost, the lowest in the league. The median club’s are worth 111%.
Over nine seasons, United’s squad lost 5% of its value a year on average, while the median club’s gained 4%.
United’s attack wasn’t wasteful: it finished its chances at about the rate they deserved. It just didn’t create enough of them for what it costs.
The defence concedes like a mid-table defence but is paid like a top-four one.
If you’re interested in the full report, you can download it below.
I hope you enjoyed this one as much as I enjoyed putting it together.
What’s the next team you’d like me to moneyball audit next? Drop your suggestions below.
Thank you for reading until the end ❤️.
See you next week,
Martin
PS. If you liked this piece chances are you’ll also enjoy how Kevin De Bruyne himself used data scientists to secure a 30% increase at 29, or how Man City used a magical data science technique to find his replacement or what Bruno Fernandes’ data science team likely argued in his ongoing negotiations with United.
P.P.S. If a tailor-made report (such as the one I did on Kai Havertz’s contract negotiation) is what interests you (including on women’s football), drop me a line.